The Modifiable Areal Unit Problem
EPID 684
Spatial Epidemiology
4/7/2022
Jon Zelner
[email protected]
epibayes.io
![]()
Scale Effects
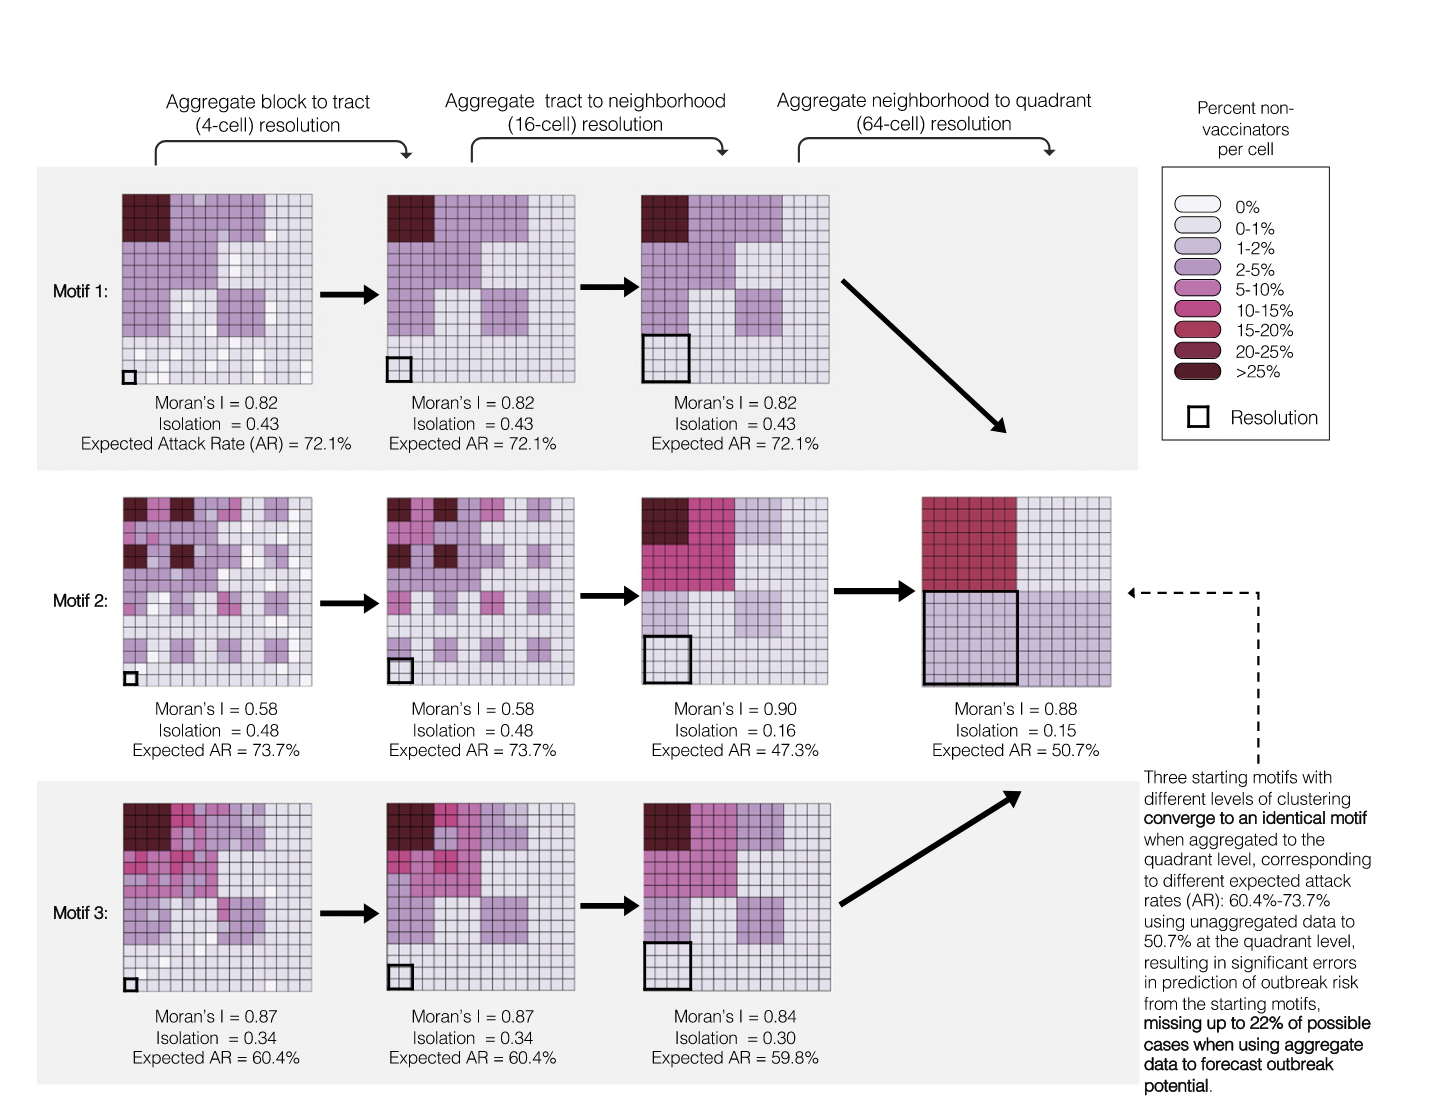
Aggregating up from low- to high-level spatial units results in biased estimates of measles outbreak risk.(1)
Zonation Effects
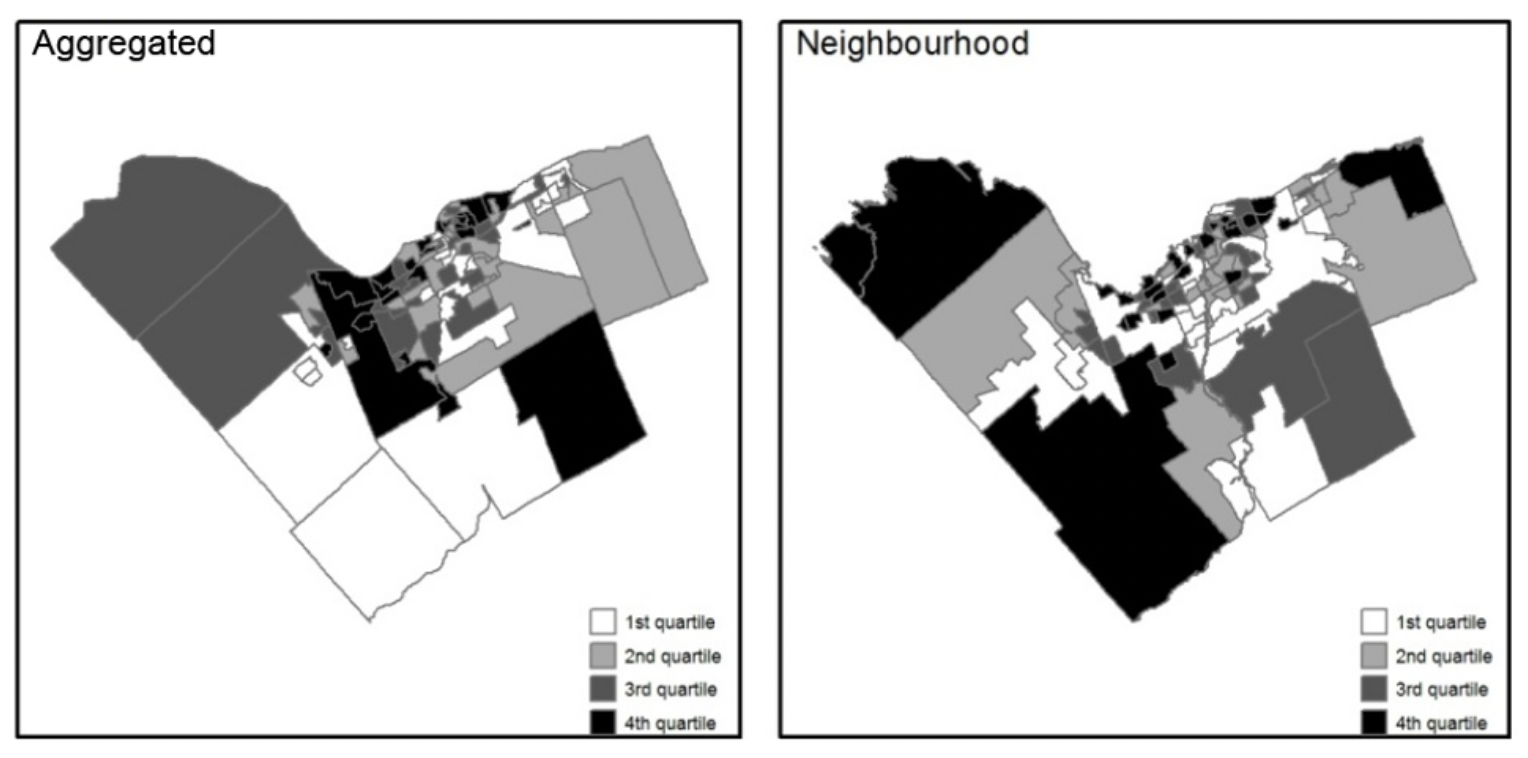
Different neighborhood boundaries at the same scale result in different estimates of local N02 exposure. (2)
Administrative boundaries are very important for characterizing variation in policy-related outcomes
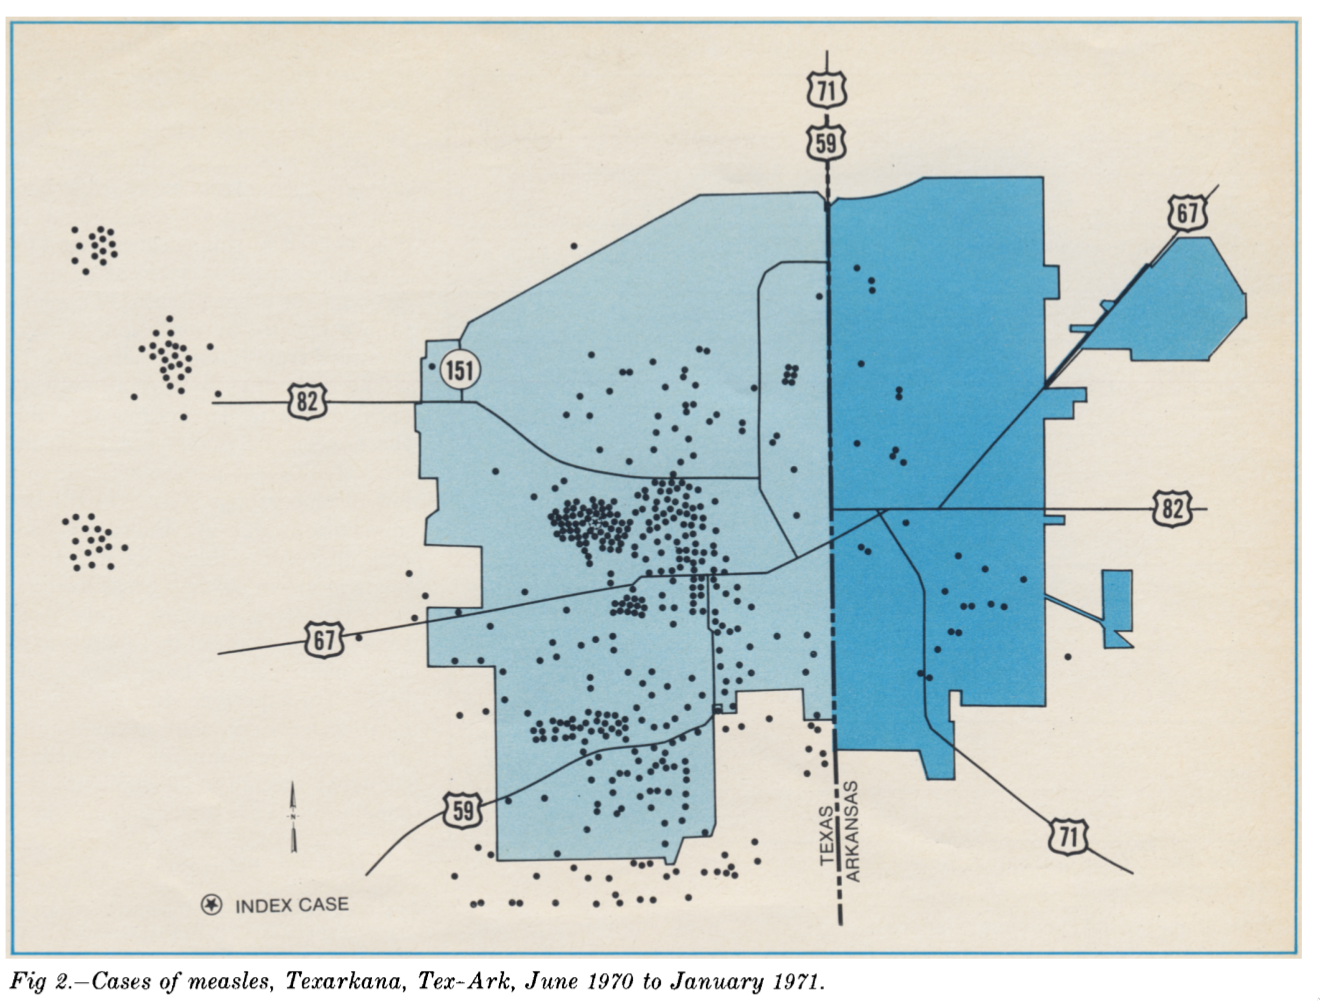
Case rates of measles between Texarkana, TX and Texarkana, AR reflected state-level policy differences (3)
Environmental exposures like air pollution do not respect administrative boundaries
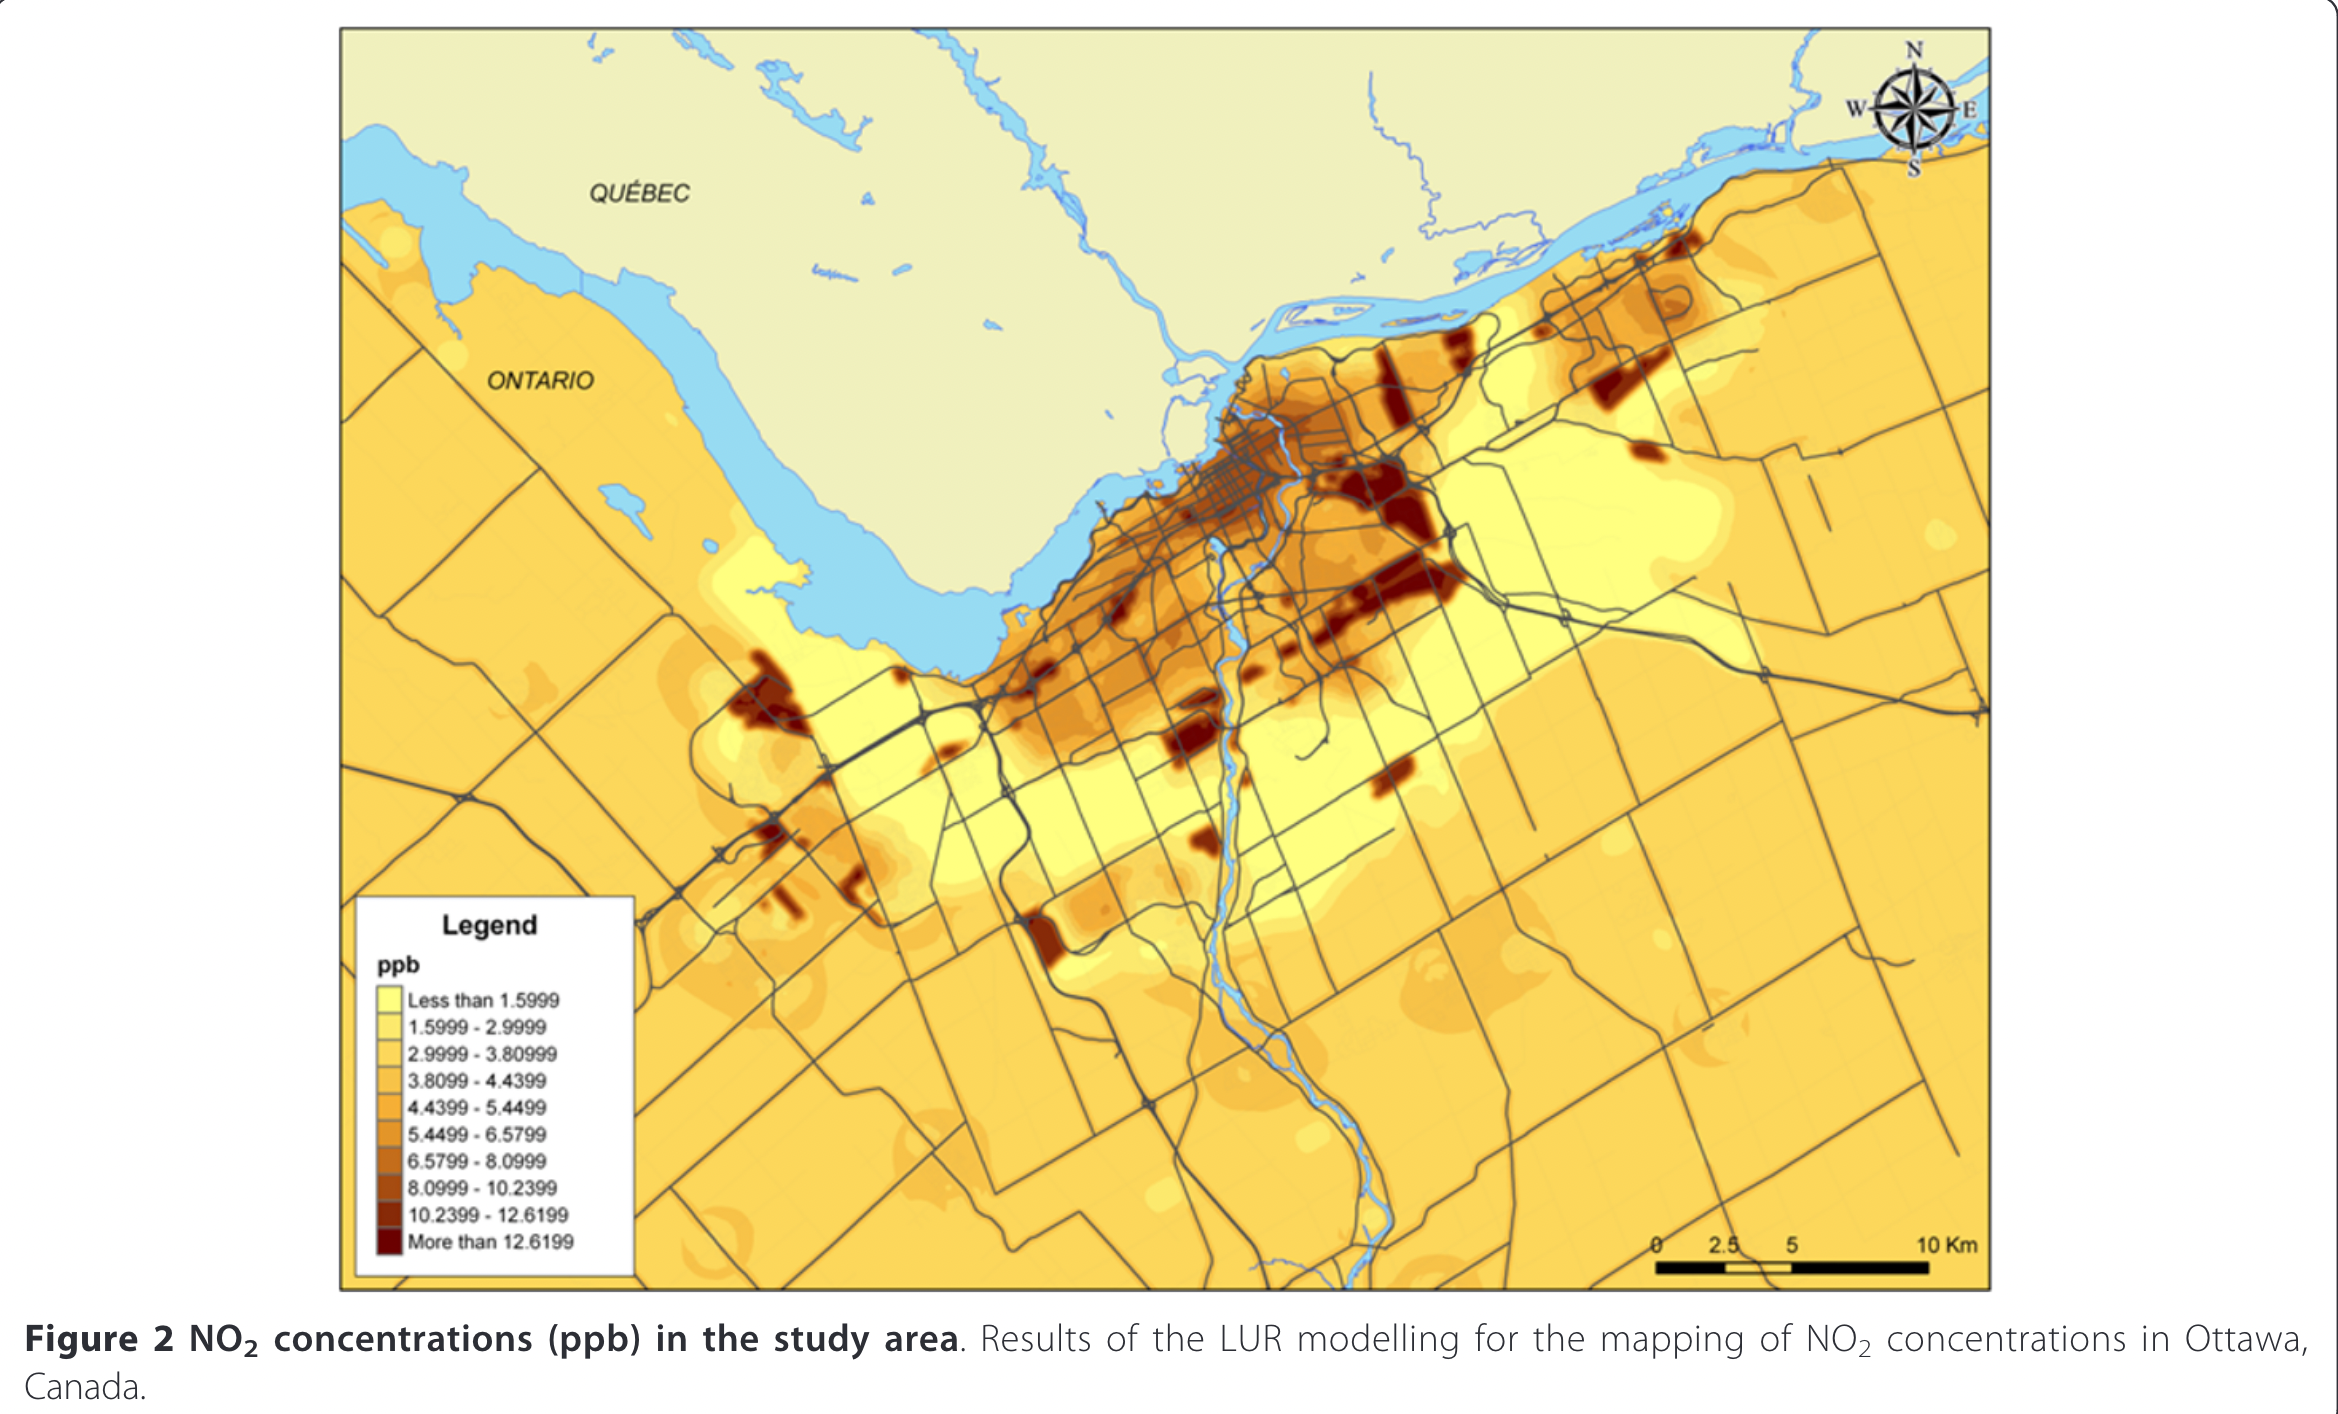
Variation in N02 exposure in Ottawa, Ontario (2)
Why should we be concerned about the tyrrany of neighborhoods?
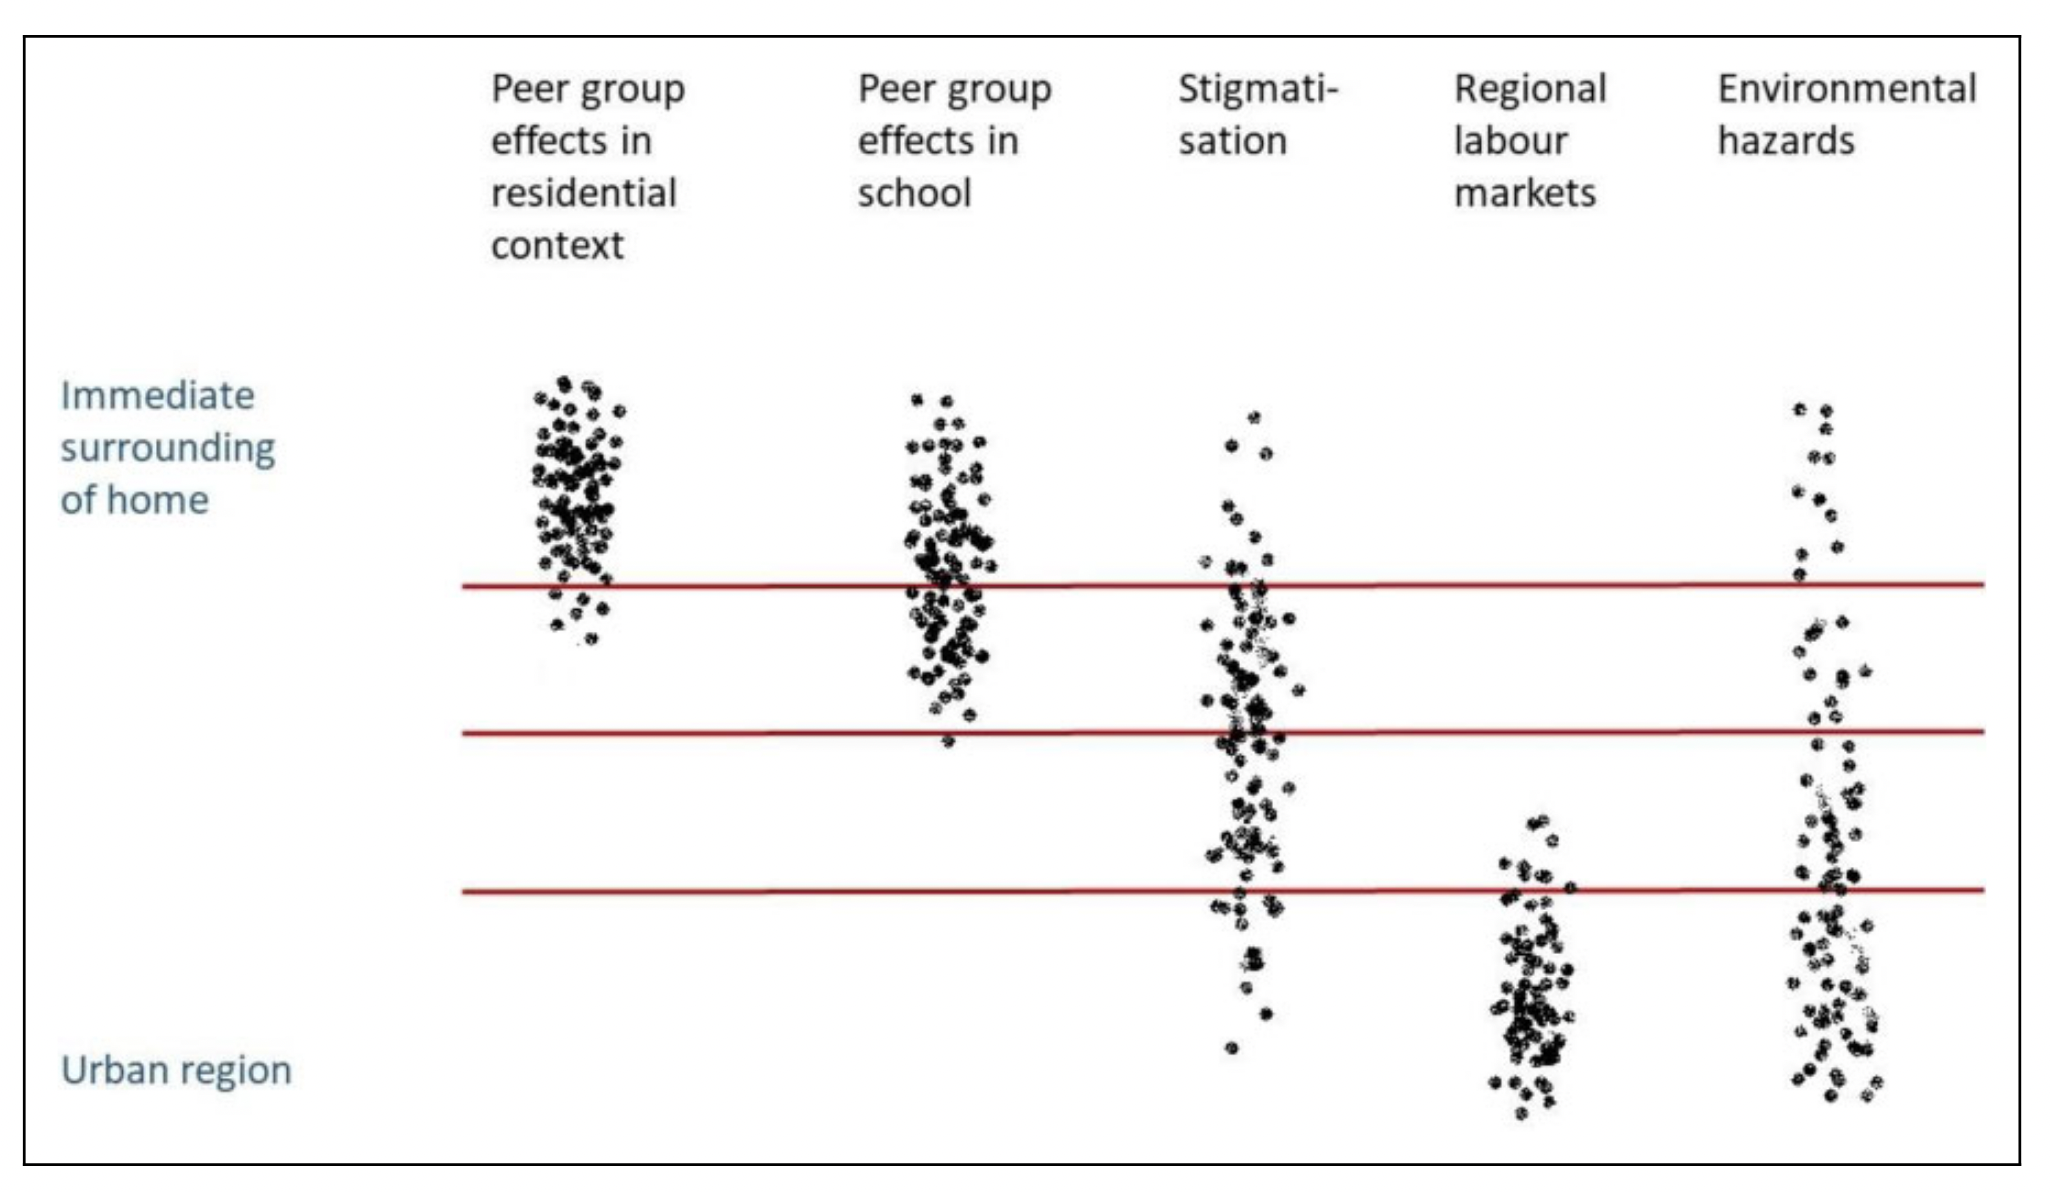 Not all exposures happen at a single scale (From (4))
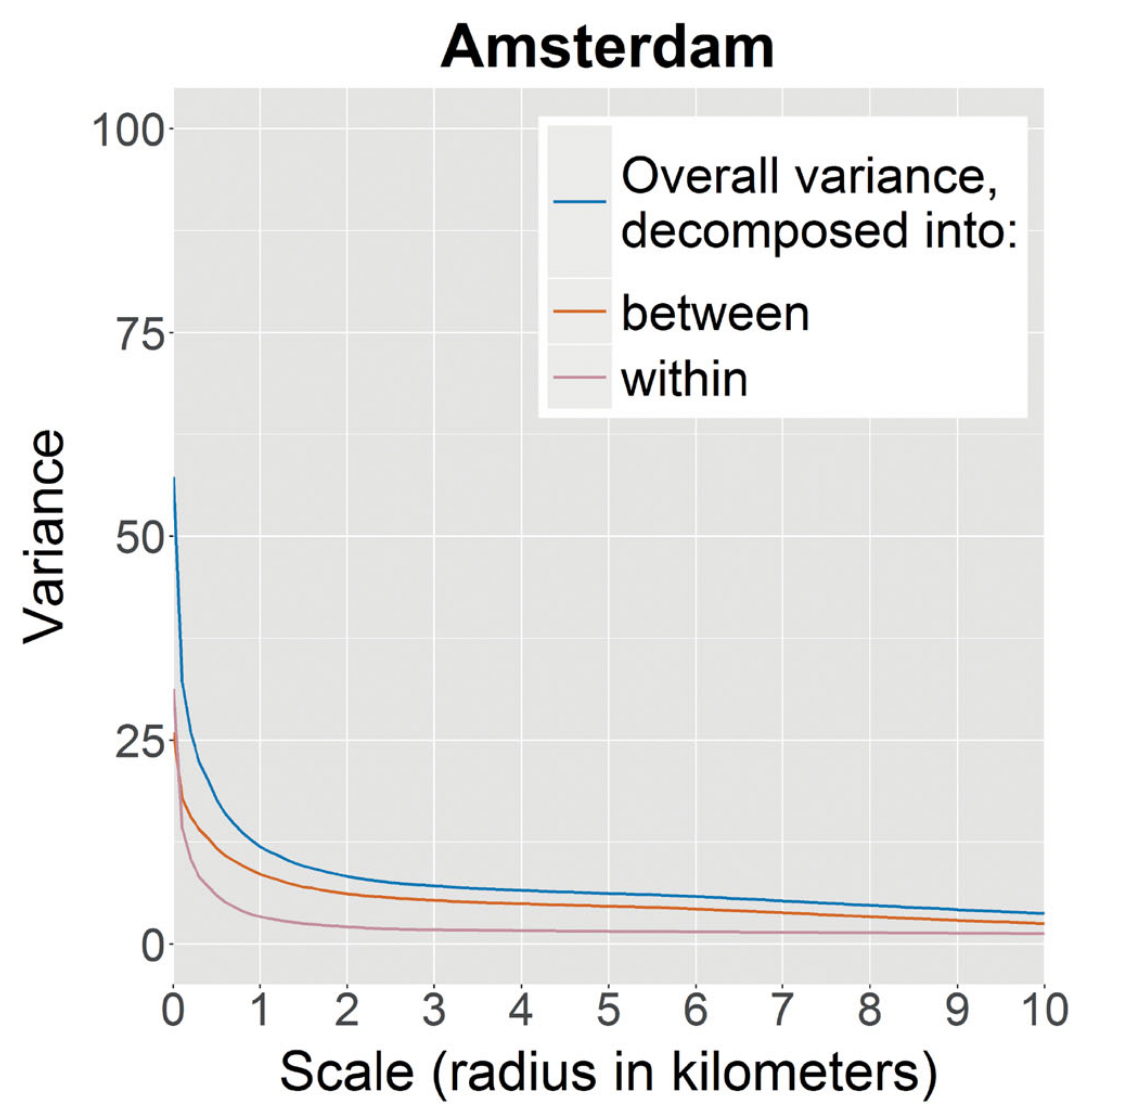
What happens to variation in income as the scale of neighborhoods increases?
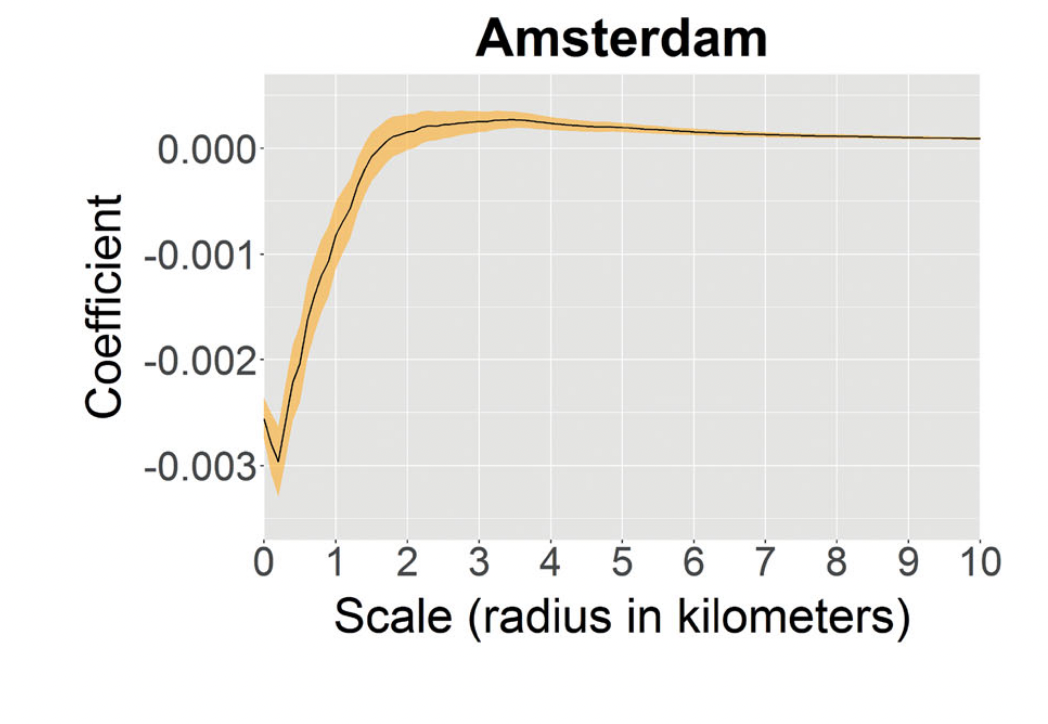
How does the relationship between individual and contextual income change over distance?
Next Time
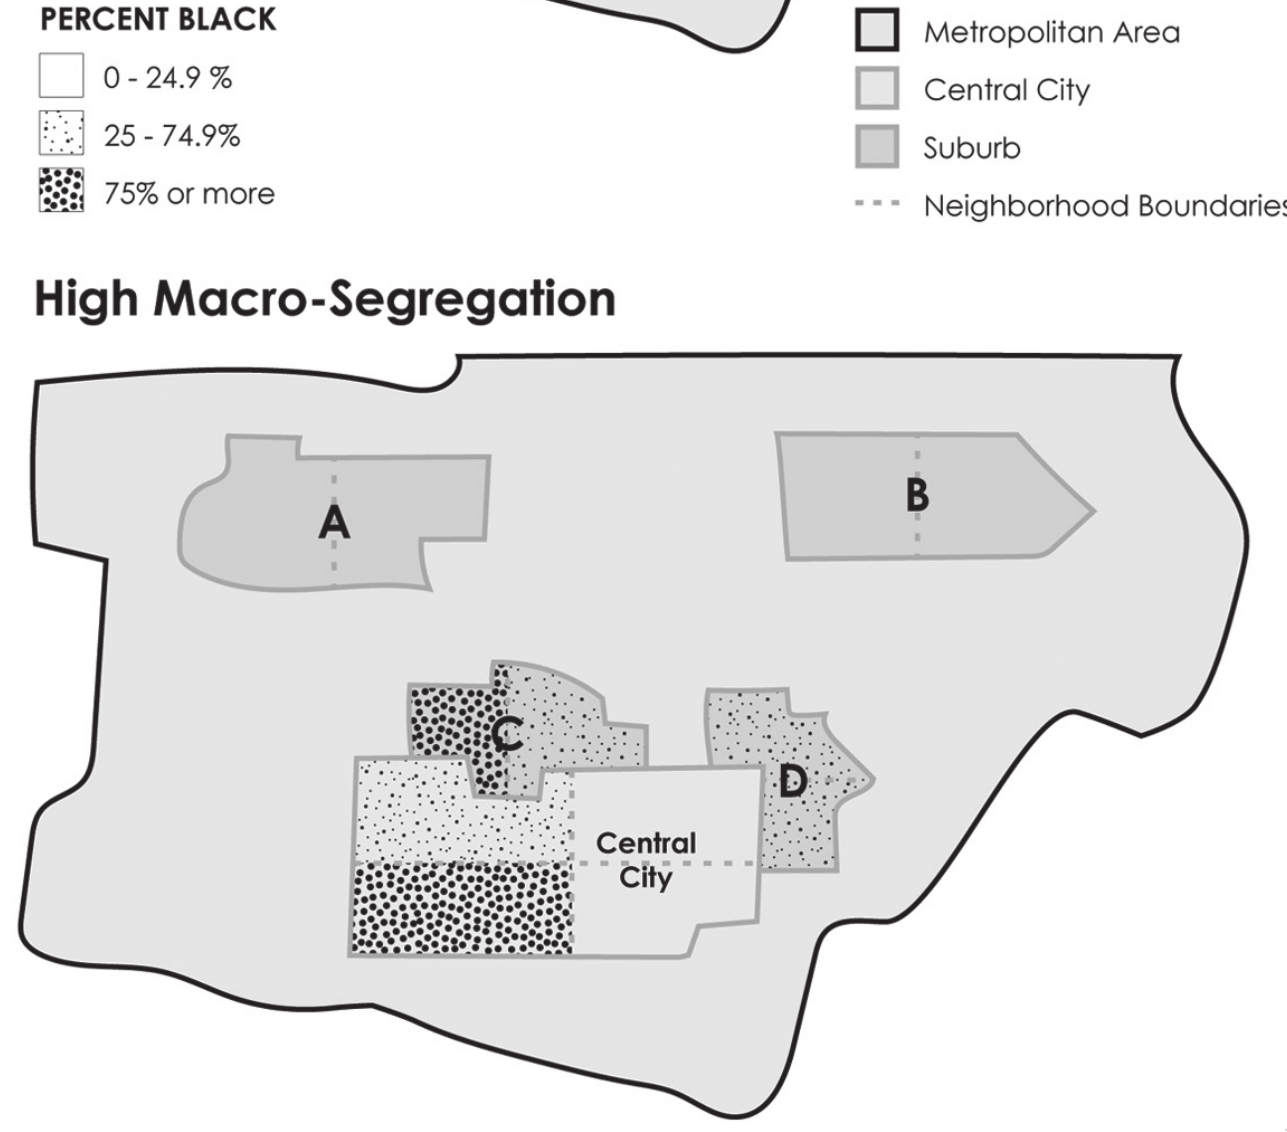
Examining segregation as a multi-scalar, multi-dimensional phenomenon