Using cellphone mobility data to make sense of infection heterogeneity
EPID 684
Spatial Epidemiology
4/14/2022
Jon Zelner
[email protected]
epibayes.io
![]()
Mobility data have become more prominent during the COVID-19 pandemic
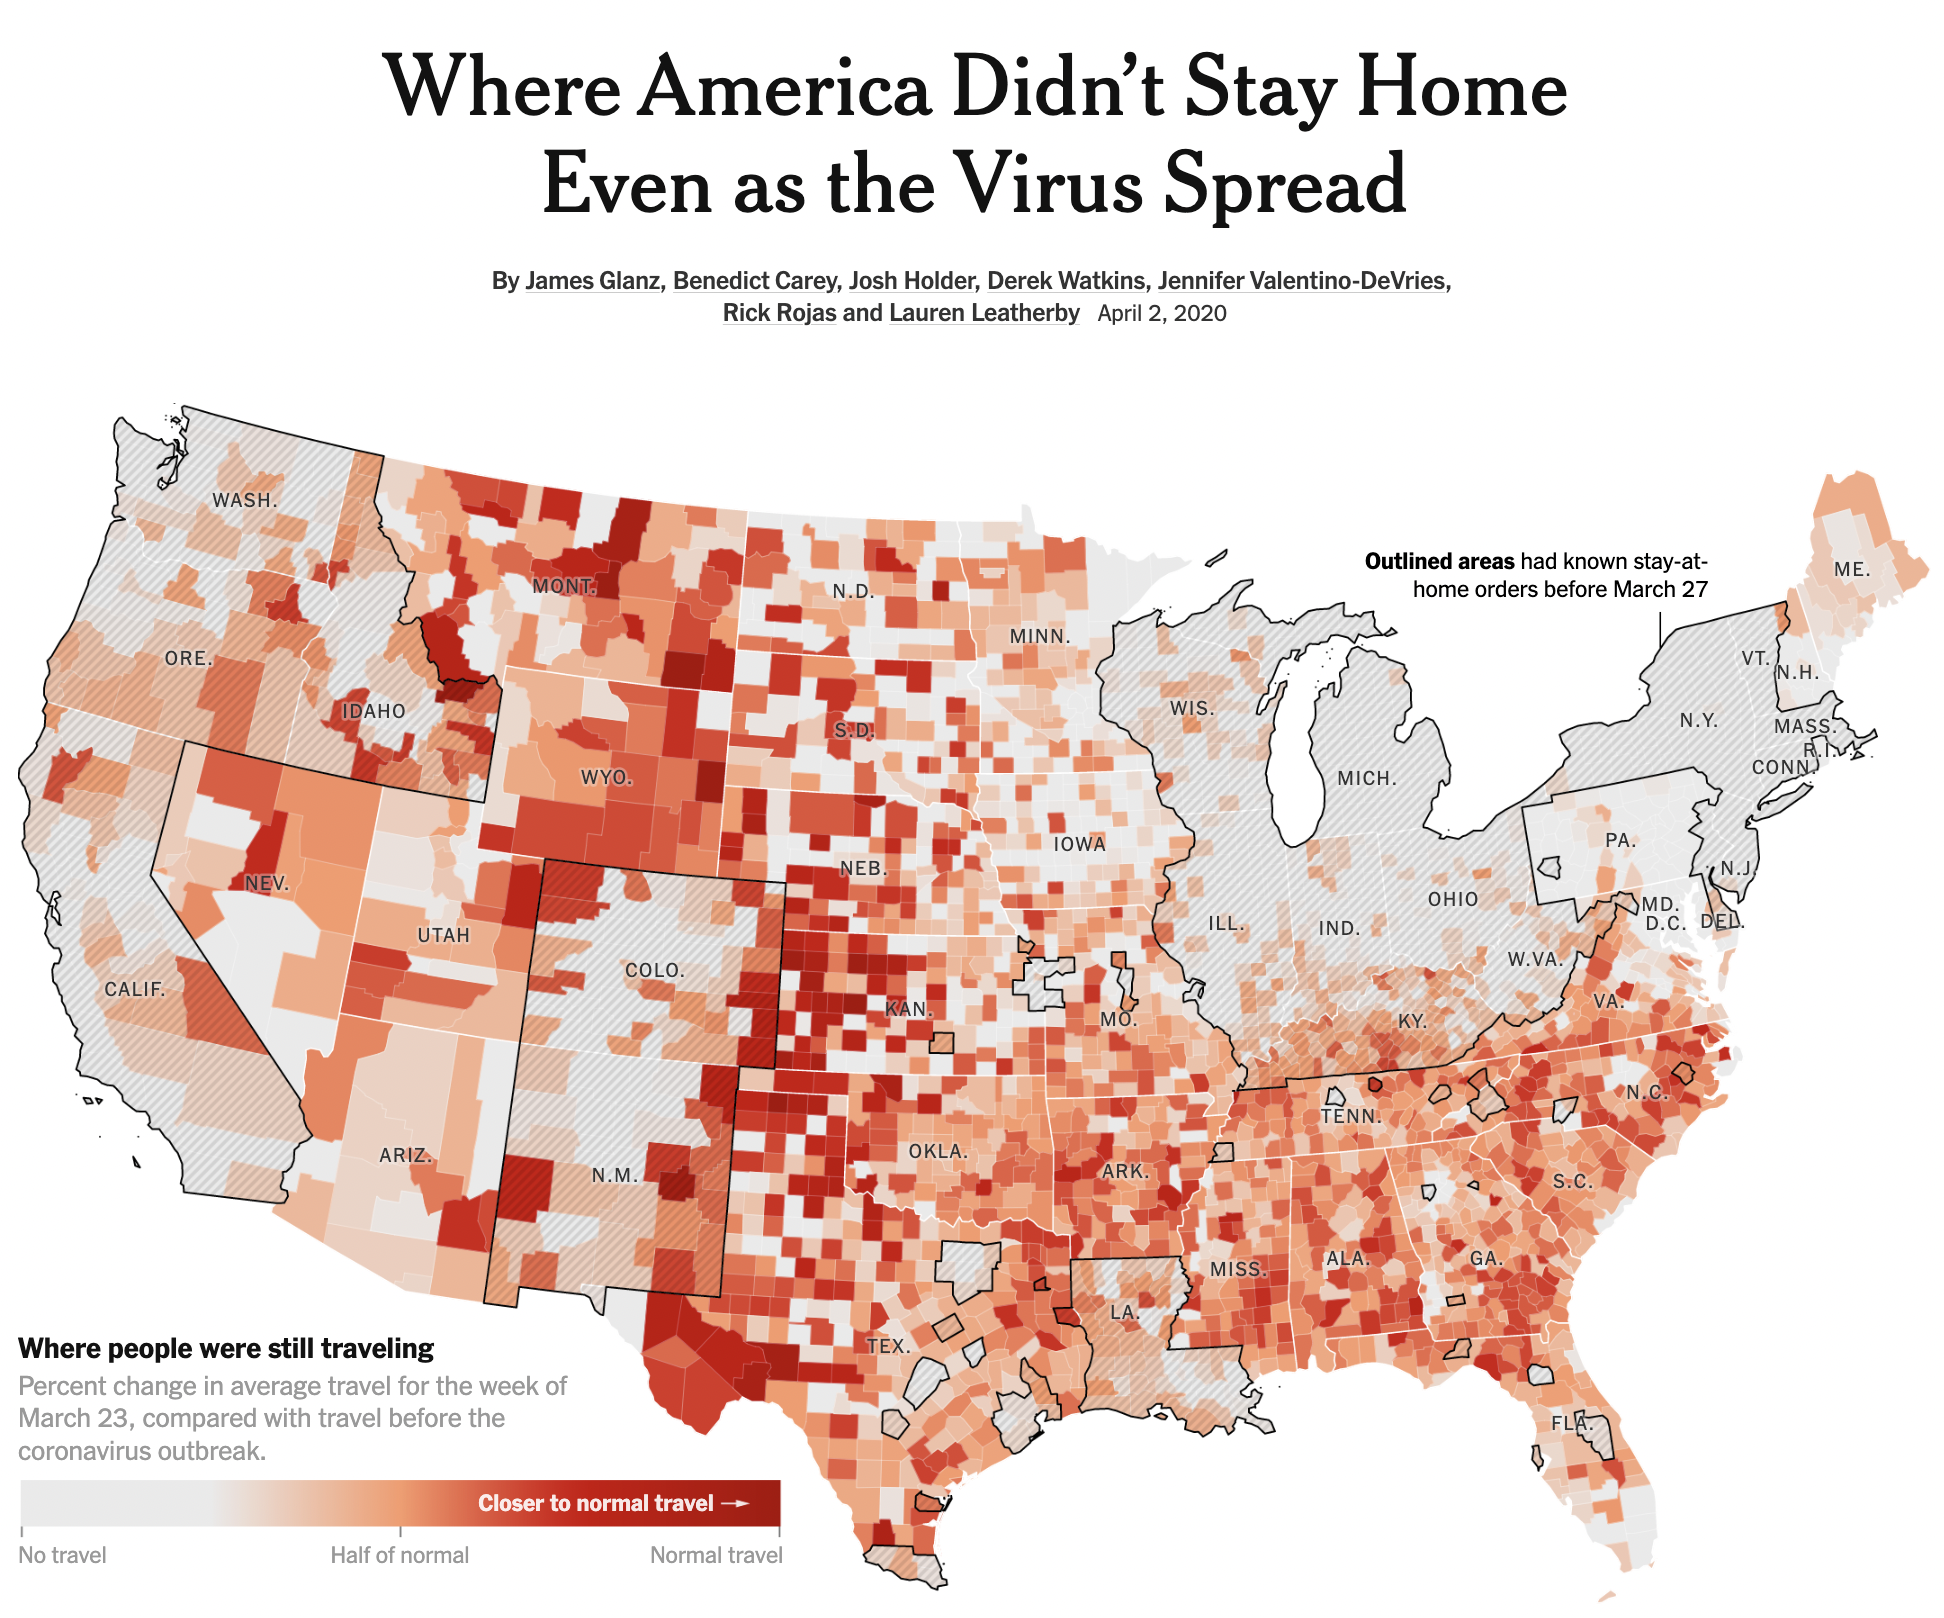
Relating mobility to COVID-19 spread in the early days of the pandemic (1)
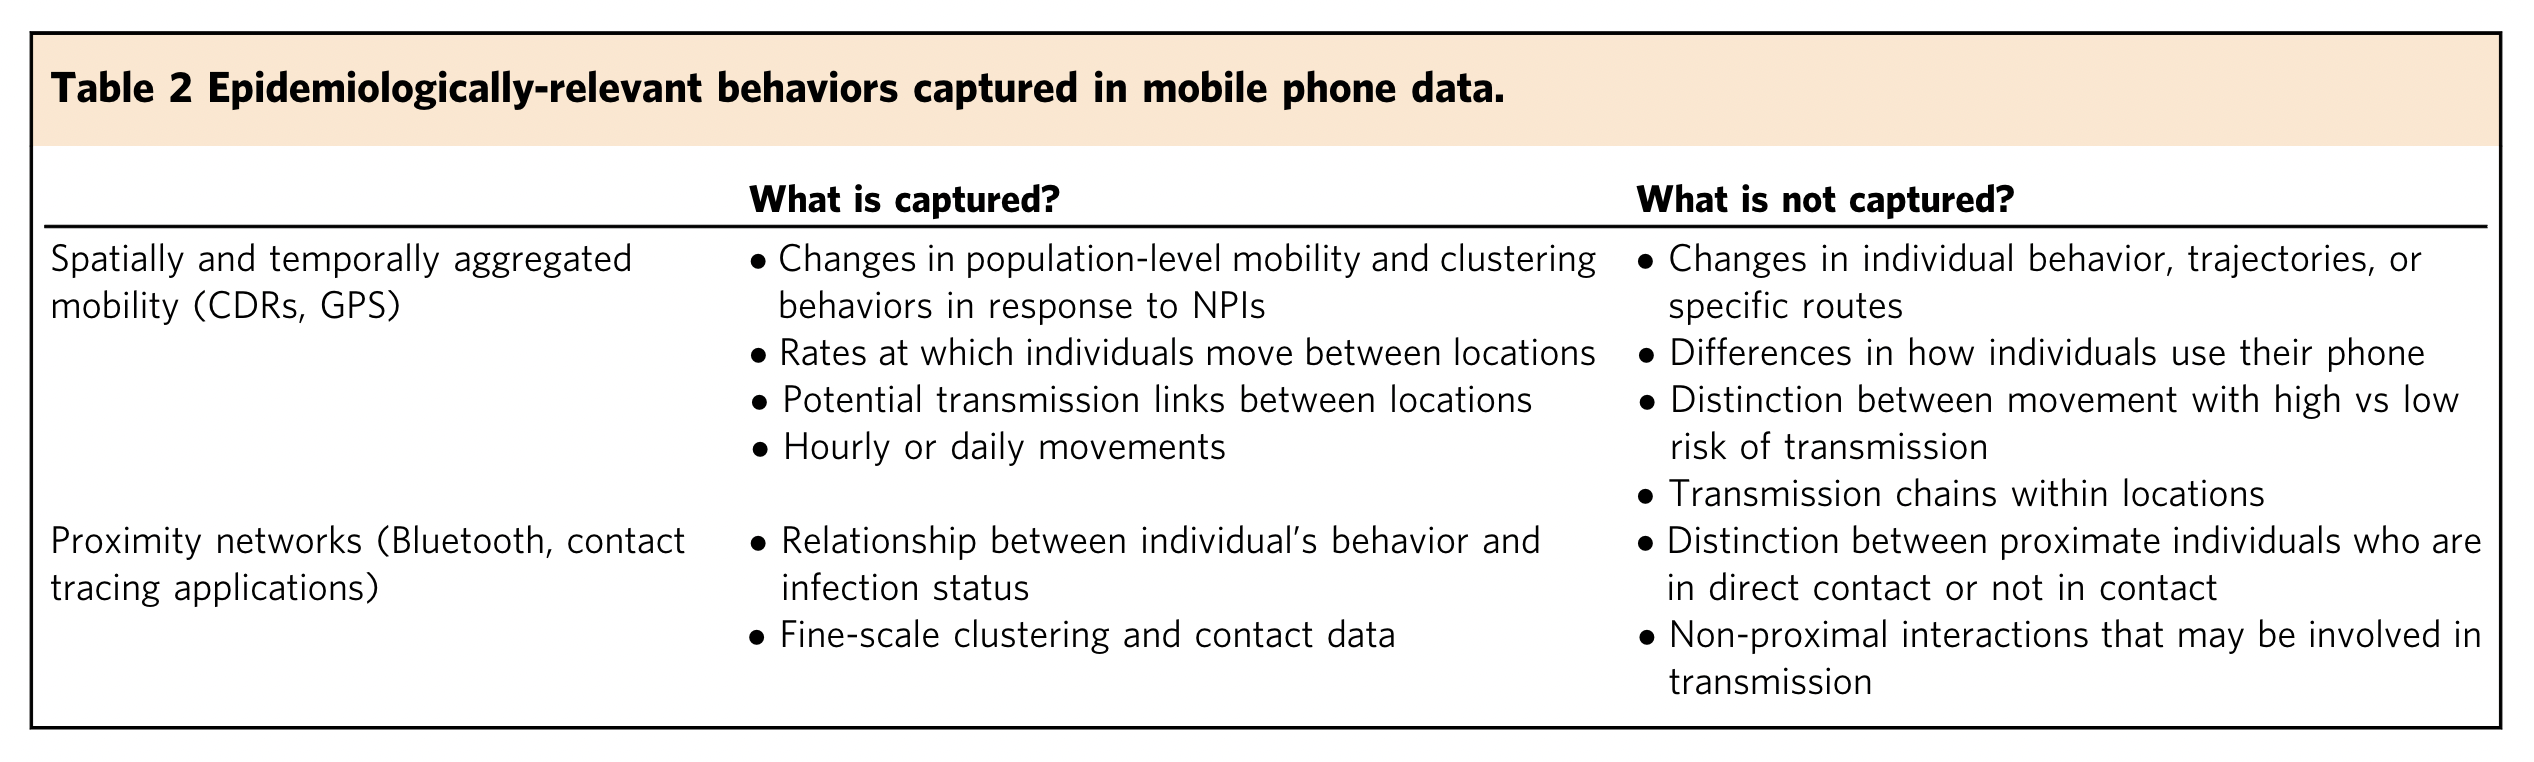
What can mobility data capture that is relevant to understanding infectious disease transmission?
Mobility data have revealed potential drivers of inequities in COVID-19 risk
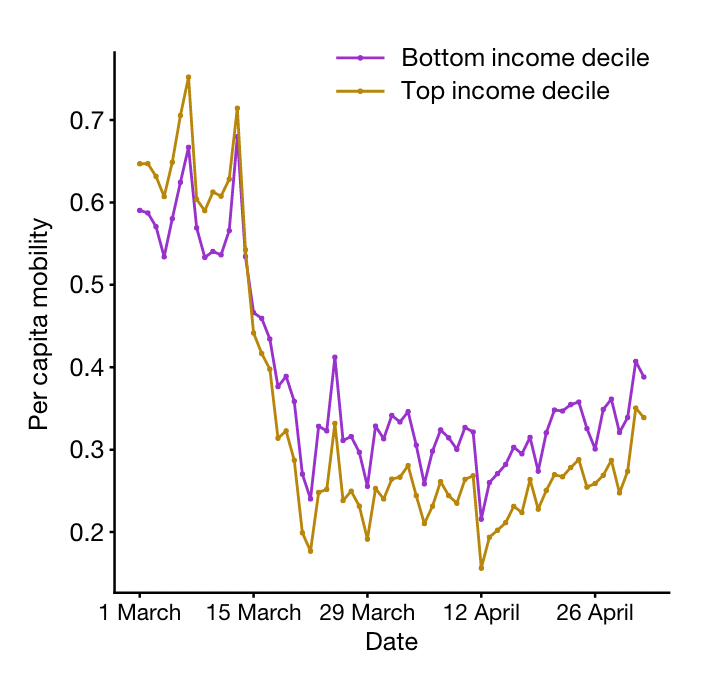
Changes in mobility by income decile in early 2020 in the U.S. from Chang et al. (2)
Income-related mobility differences reflect differential occupational exposures
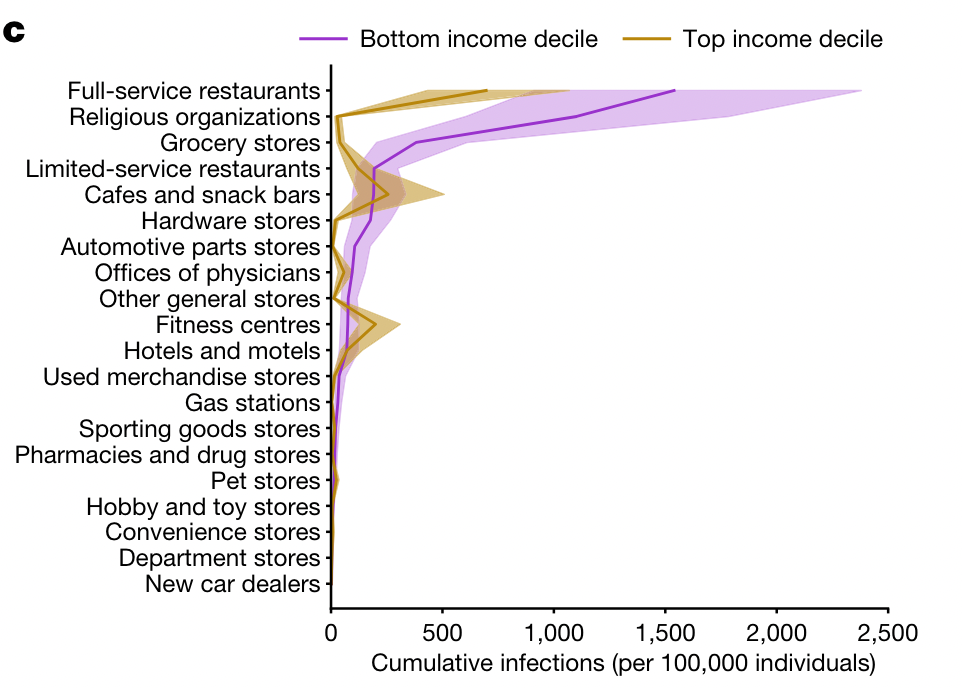
Estimated infections acquired in different types of locations by income decile from (2)
Have become important inputs to theoretical models
Mobility data were used to simulate SARS-CoV-2 transmission under different housing policy scenarios in (3)
Cell phone data come in different shapes and sizes
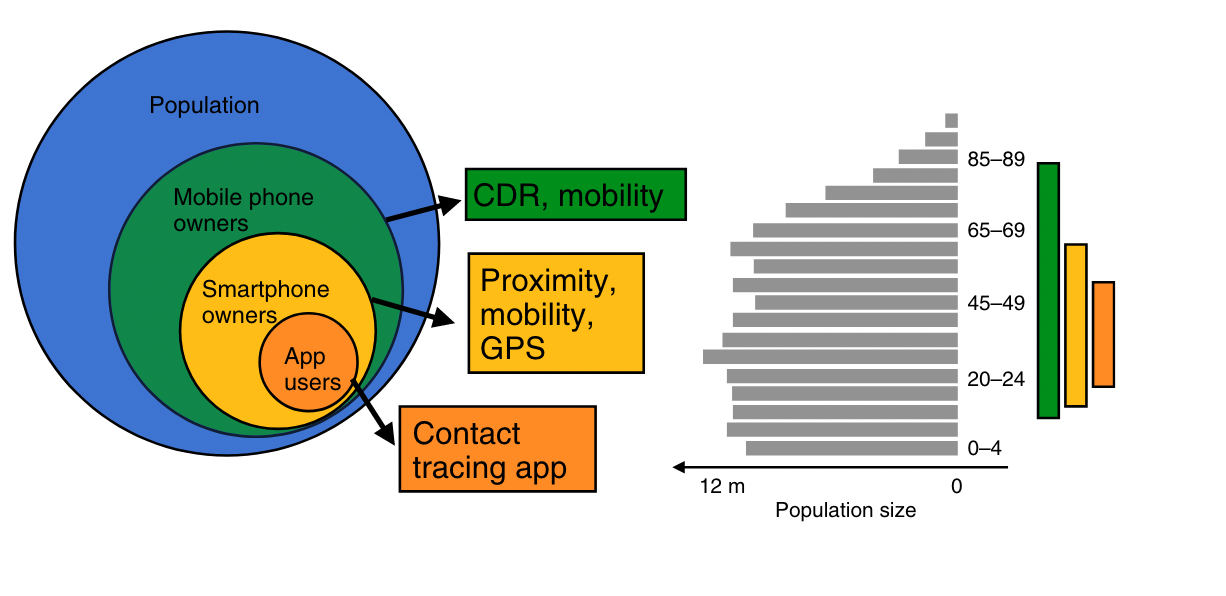
Relationships between population covered and cellphone data type (4)
A lot of processing and analysis choices take place between data collection and use
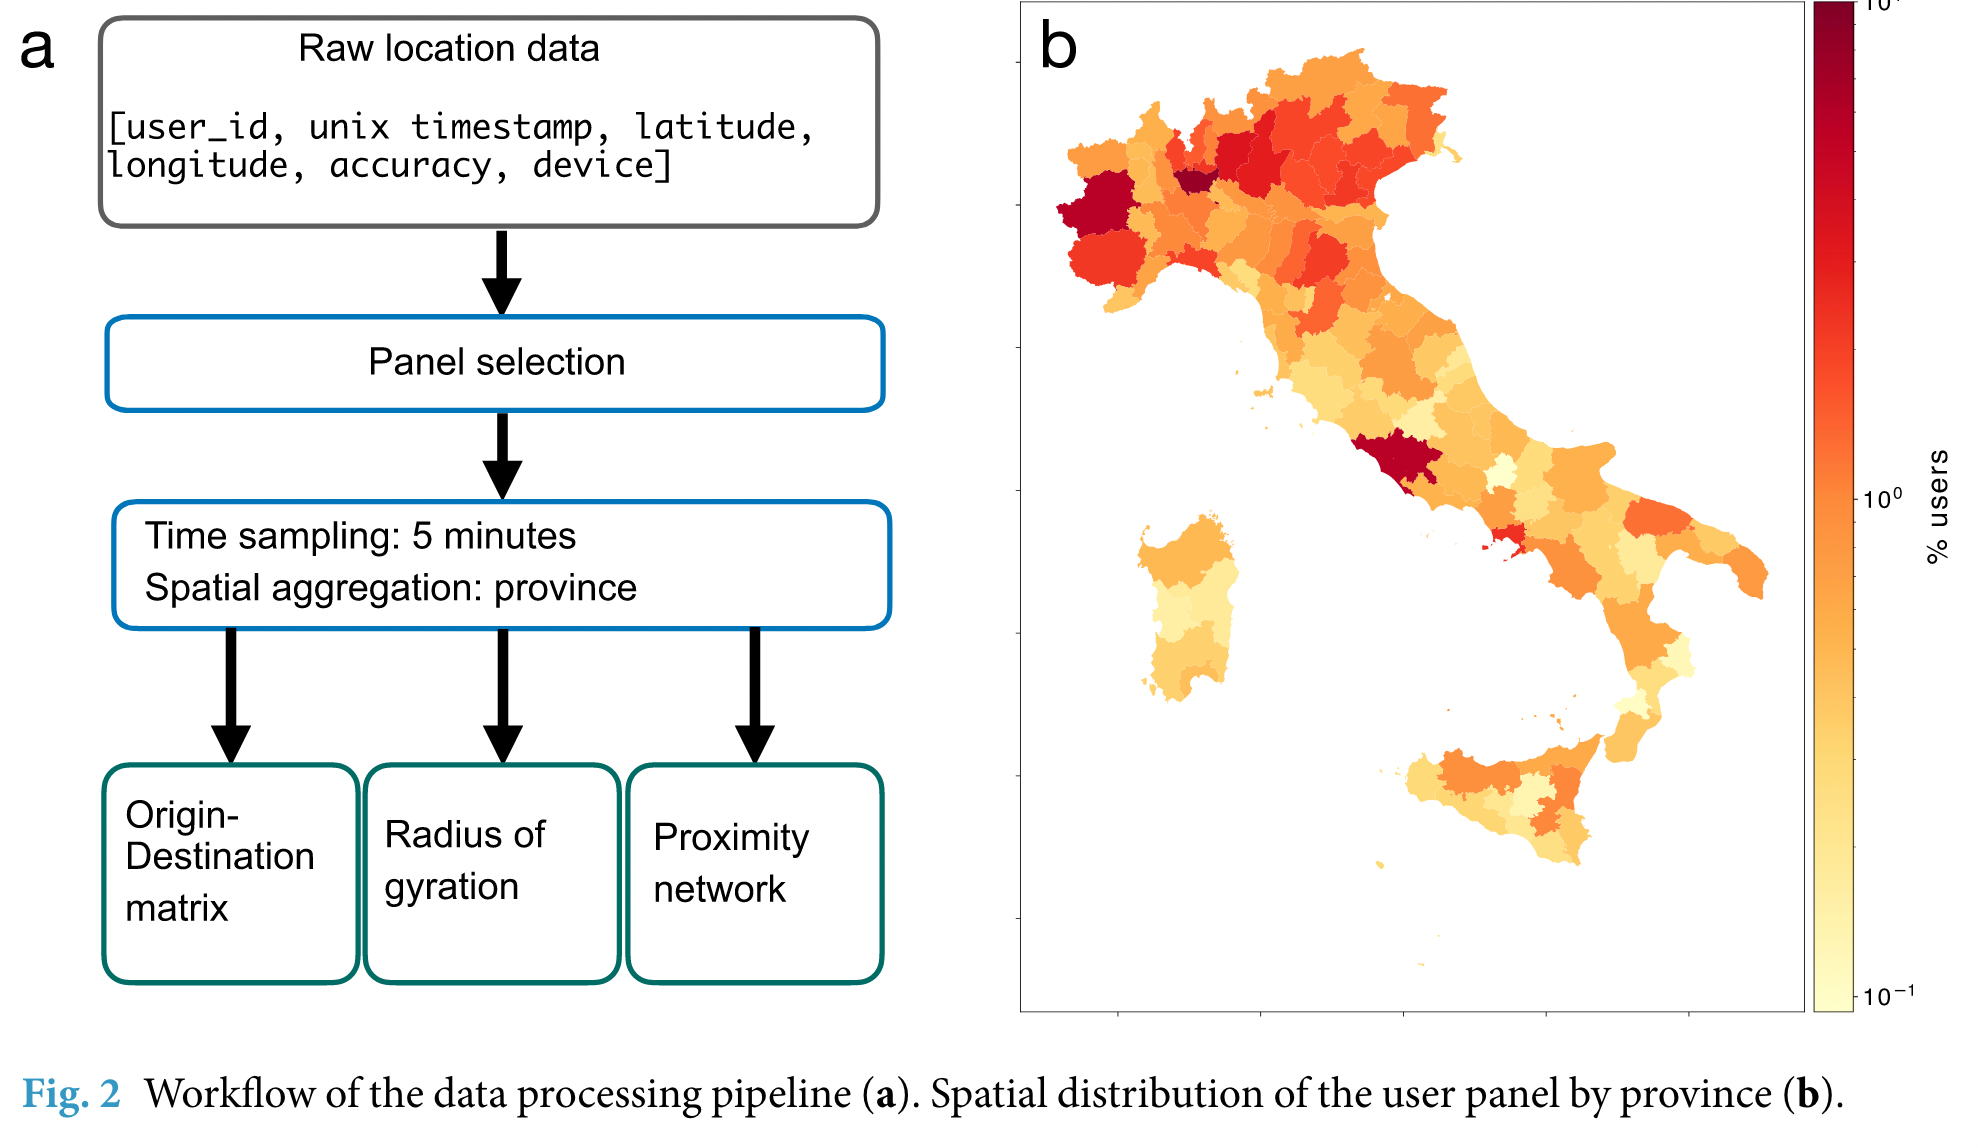
Using cellphone data to craft mobility networks in Italy during COVID-19 (5)
What is the distinction between residential and mobility neighborhood disadvantage?
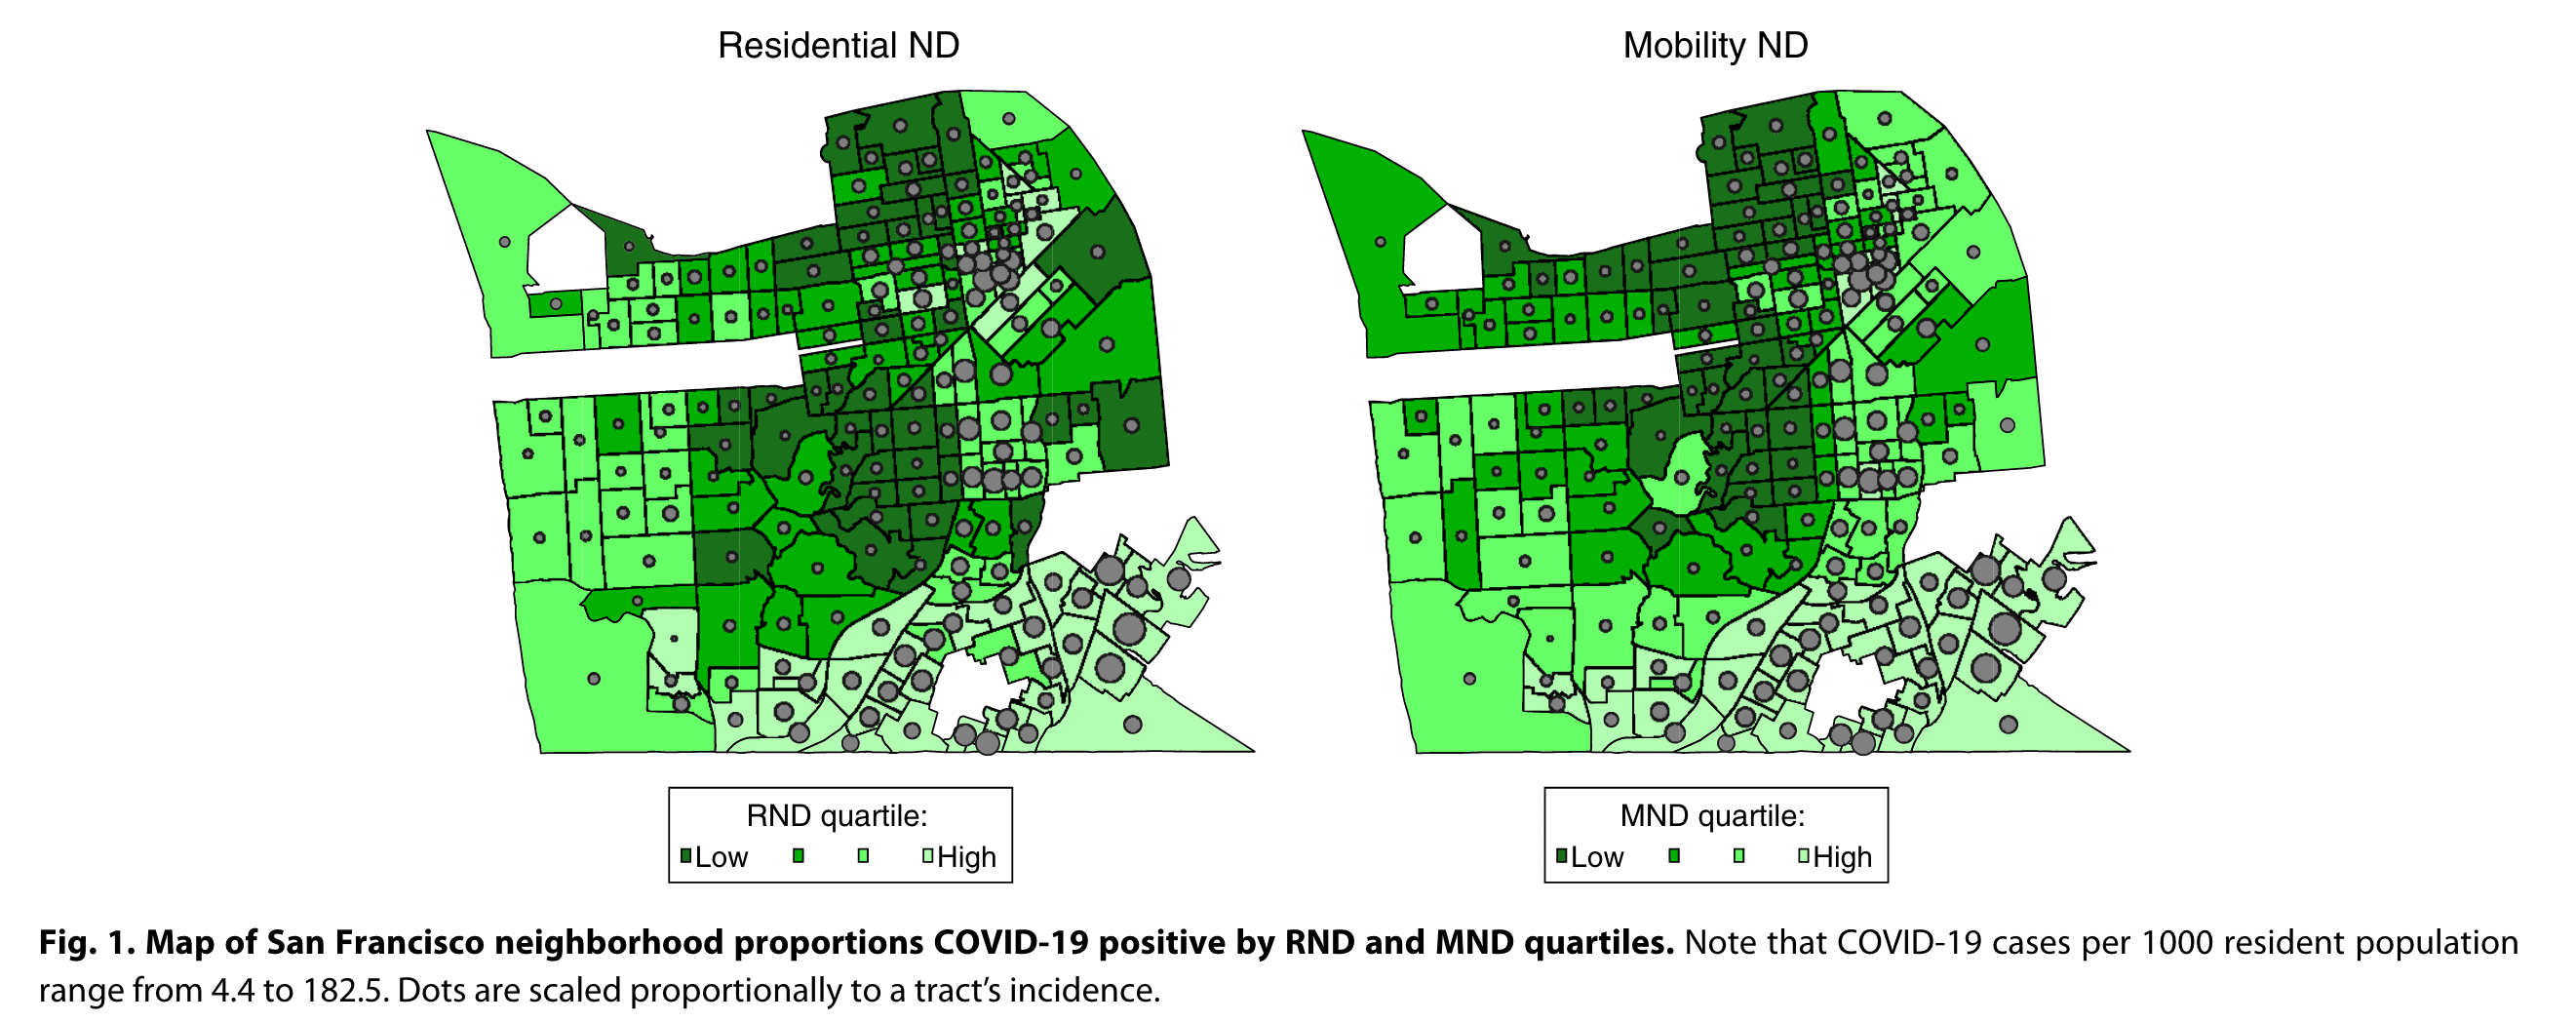
How do Levy at all conceptualize the meaning of MND and RND for risk? (6)
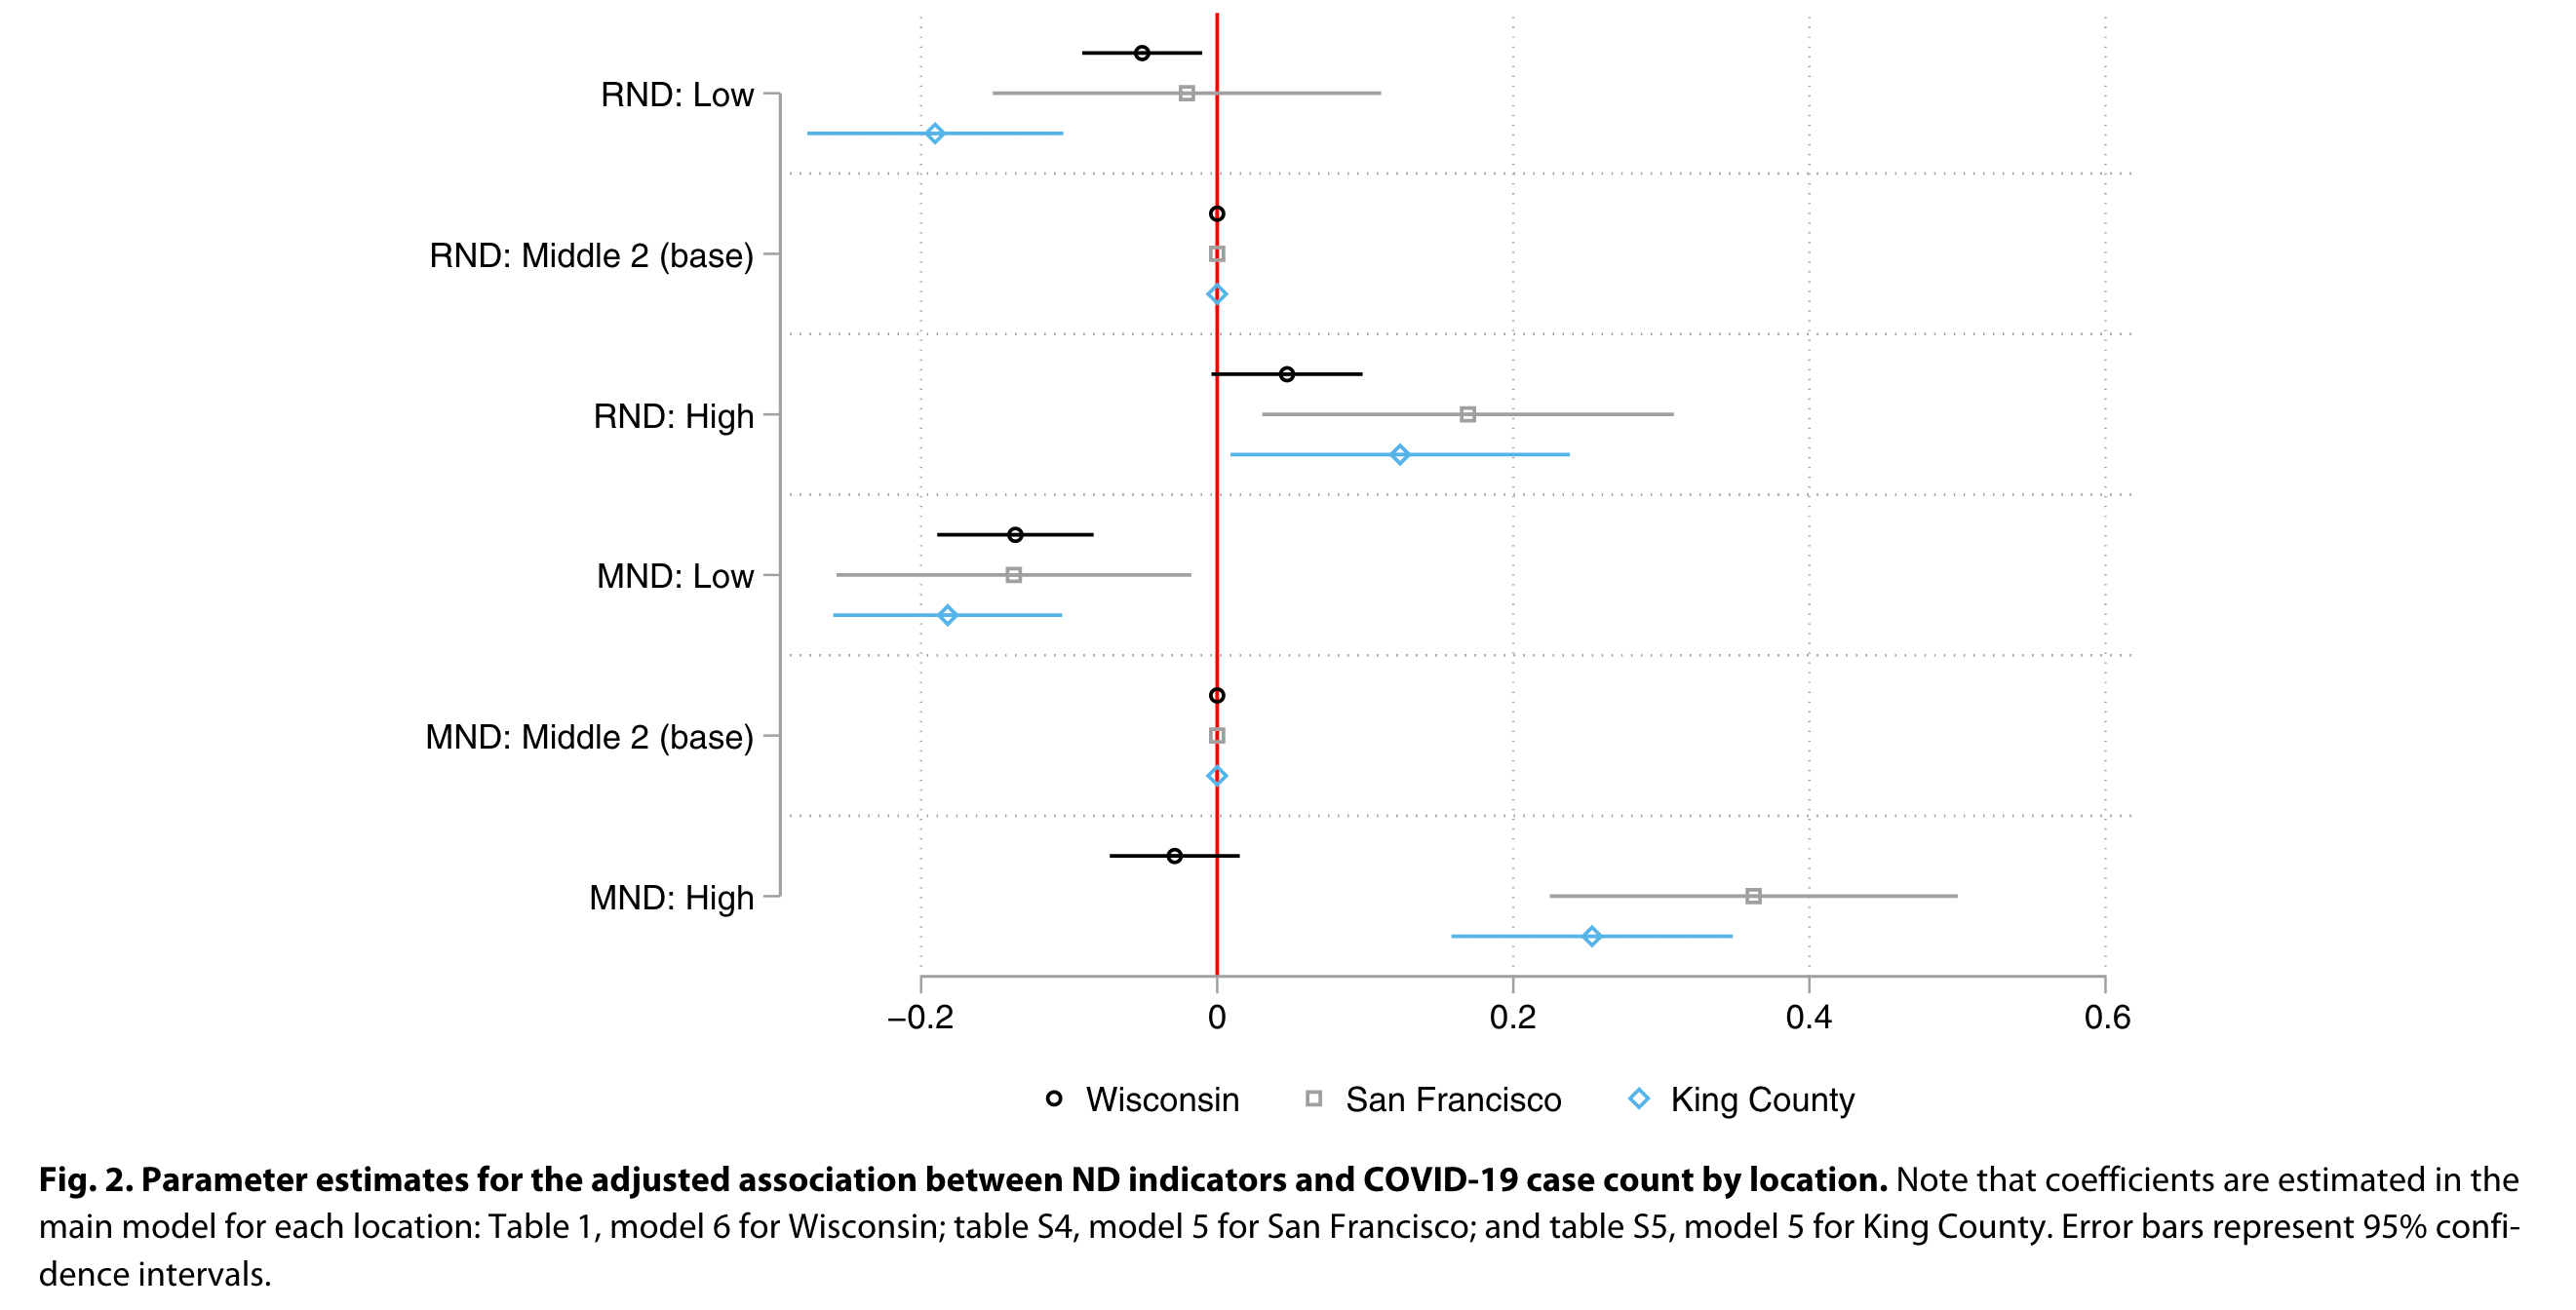
MND predicts increased COVID-19 cases after adjustment for RND
MND & RND are strong - but variable - mediators of associations with race/ethnicty
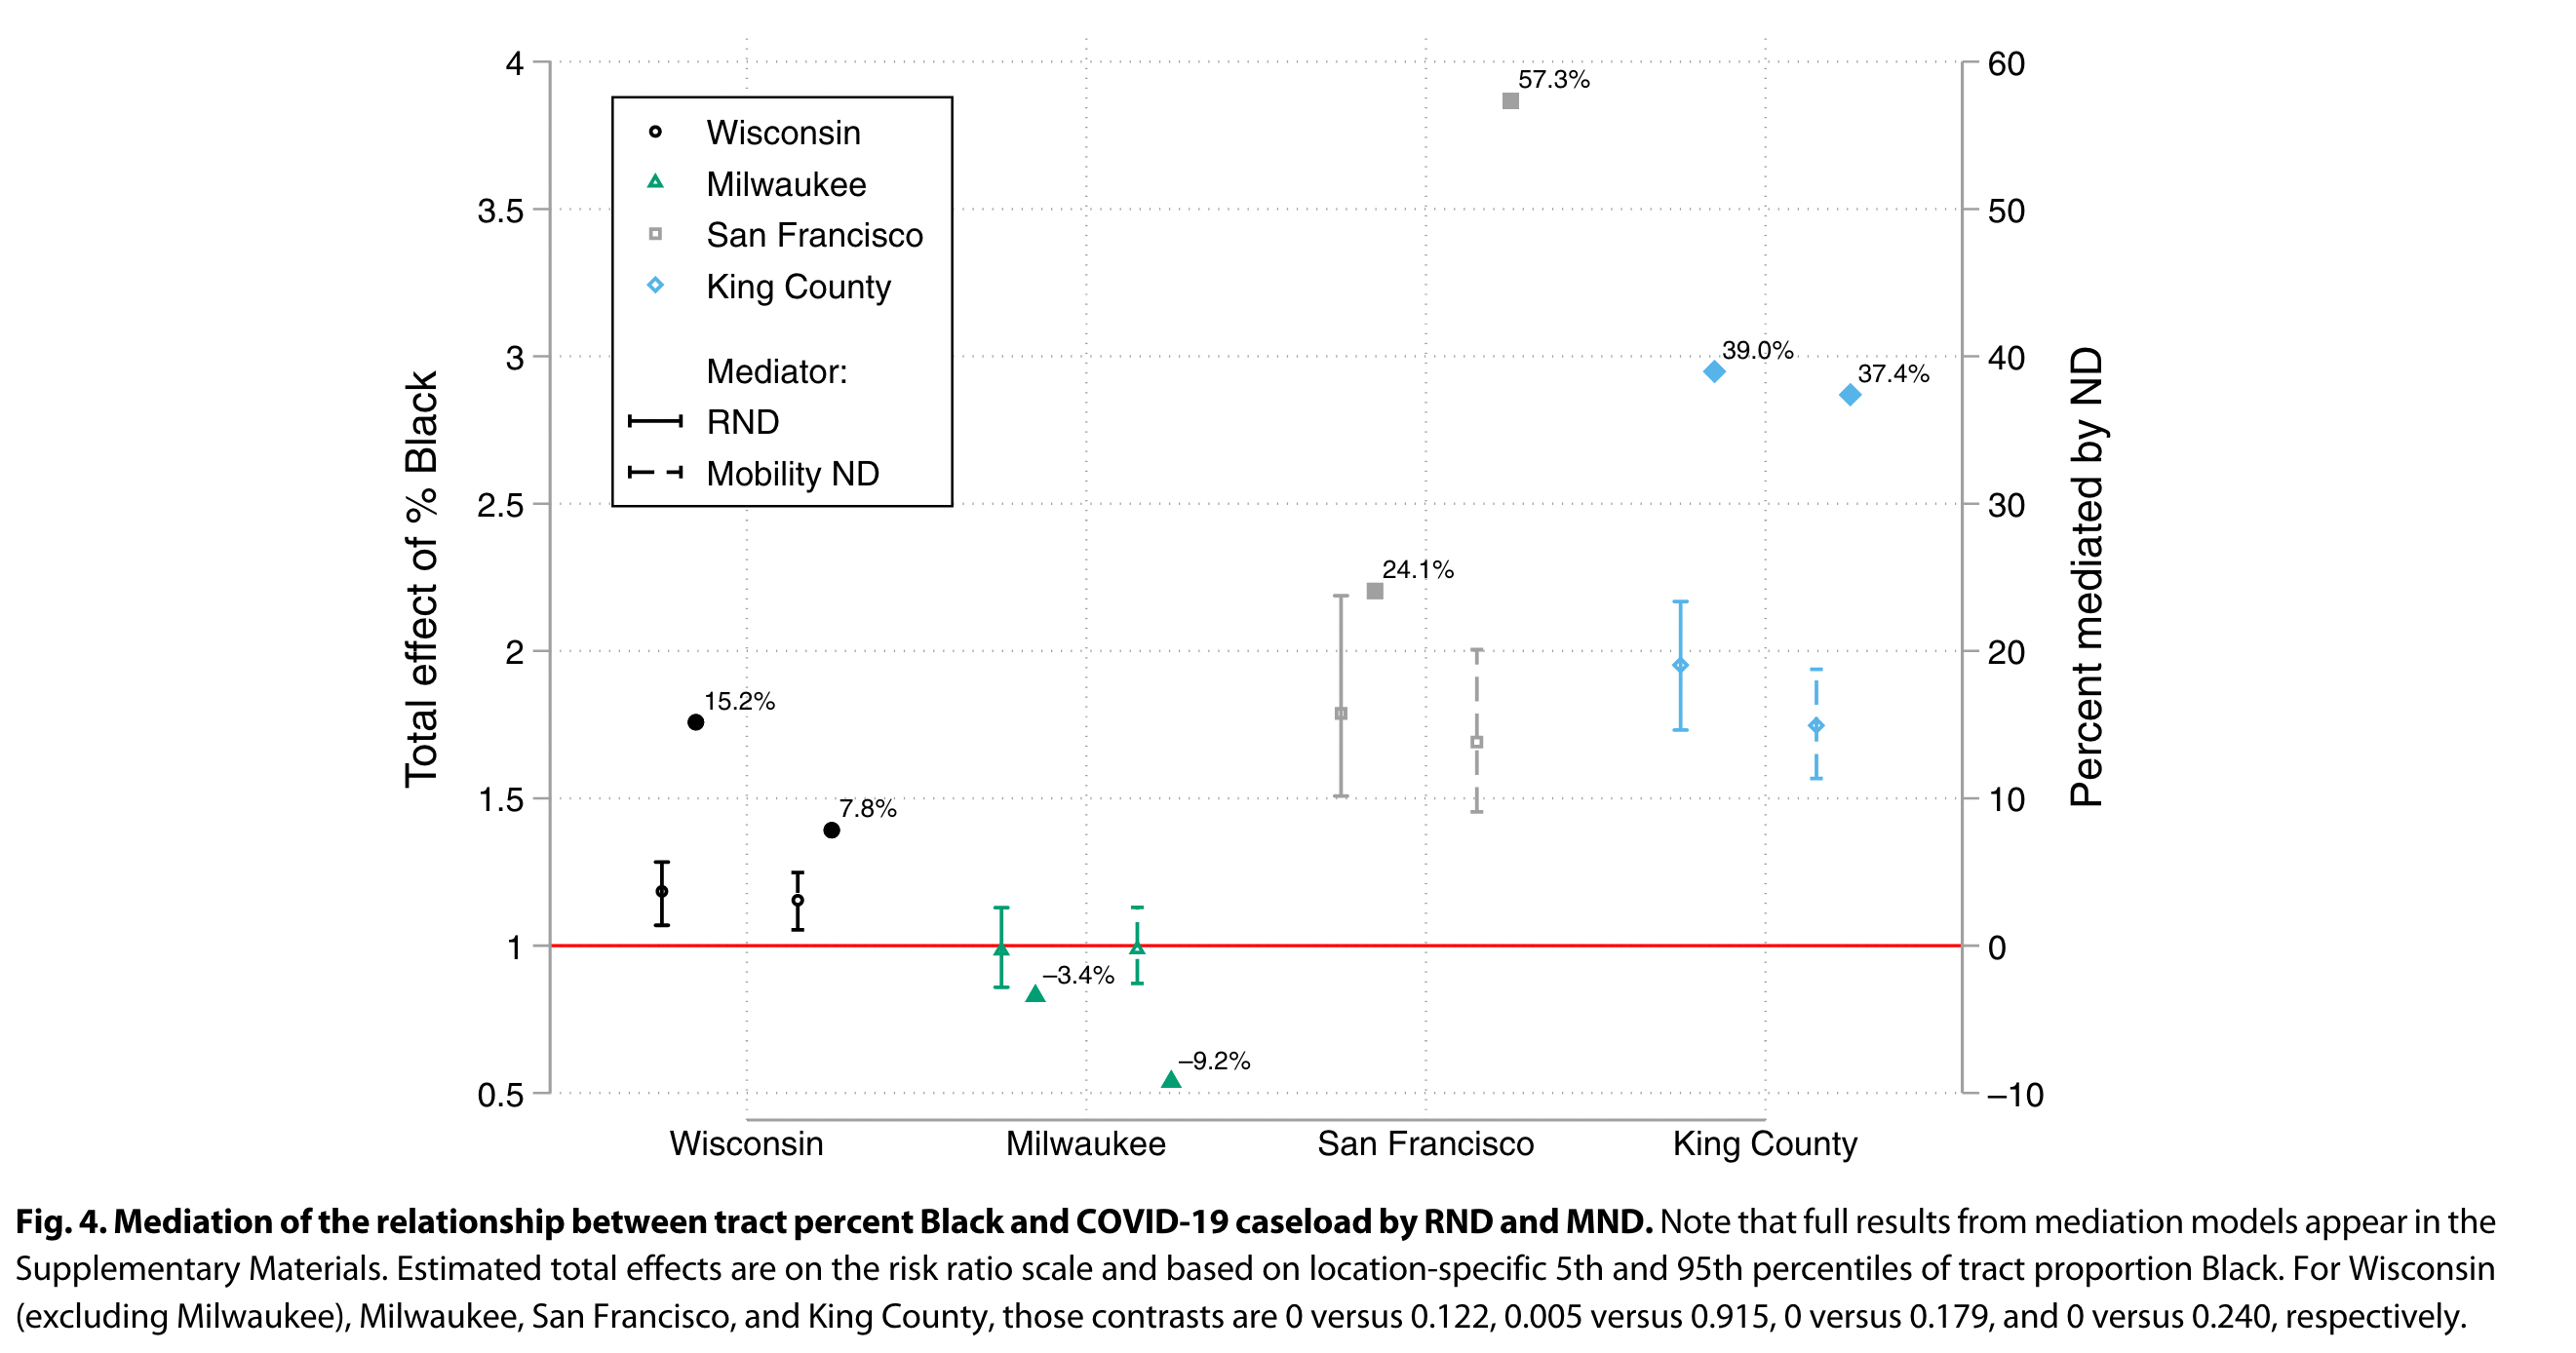
Mediation of neighborhood percent Black residents by RND, MND
These effects vary across groups
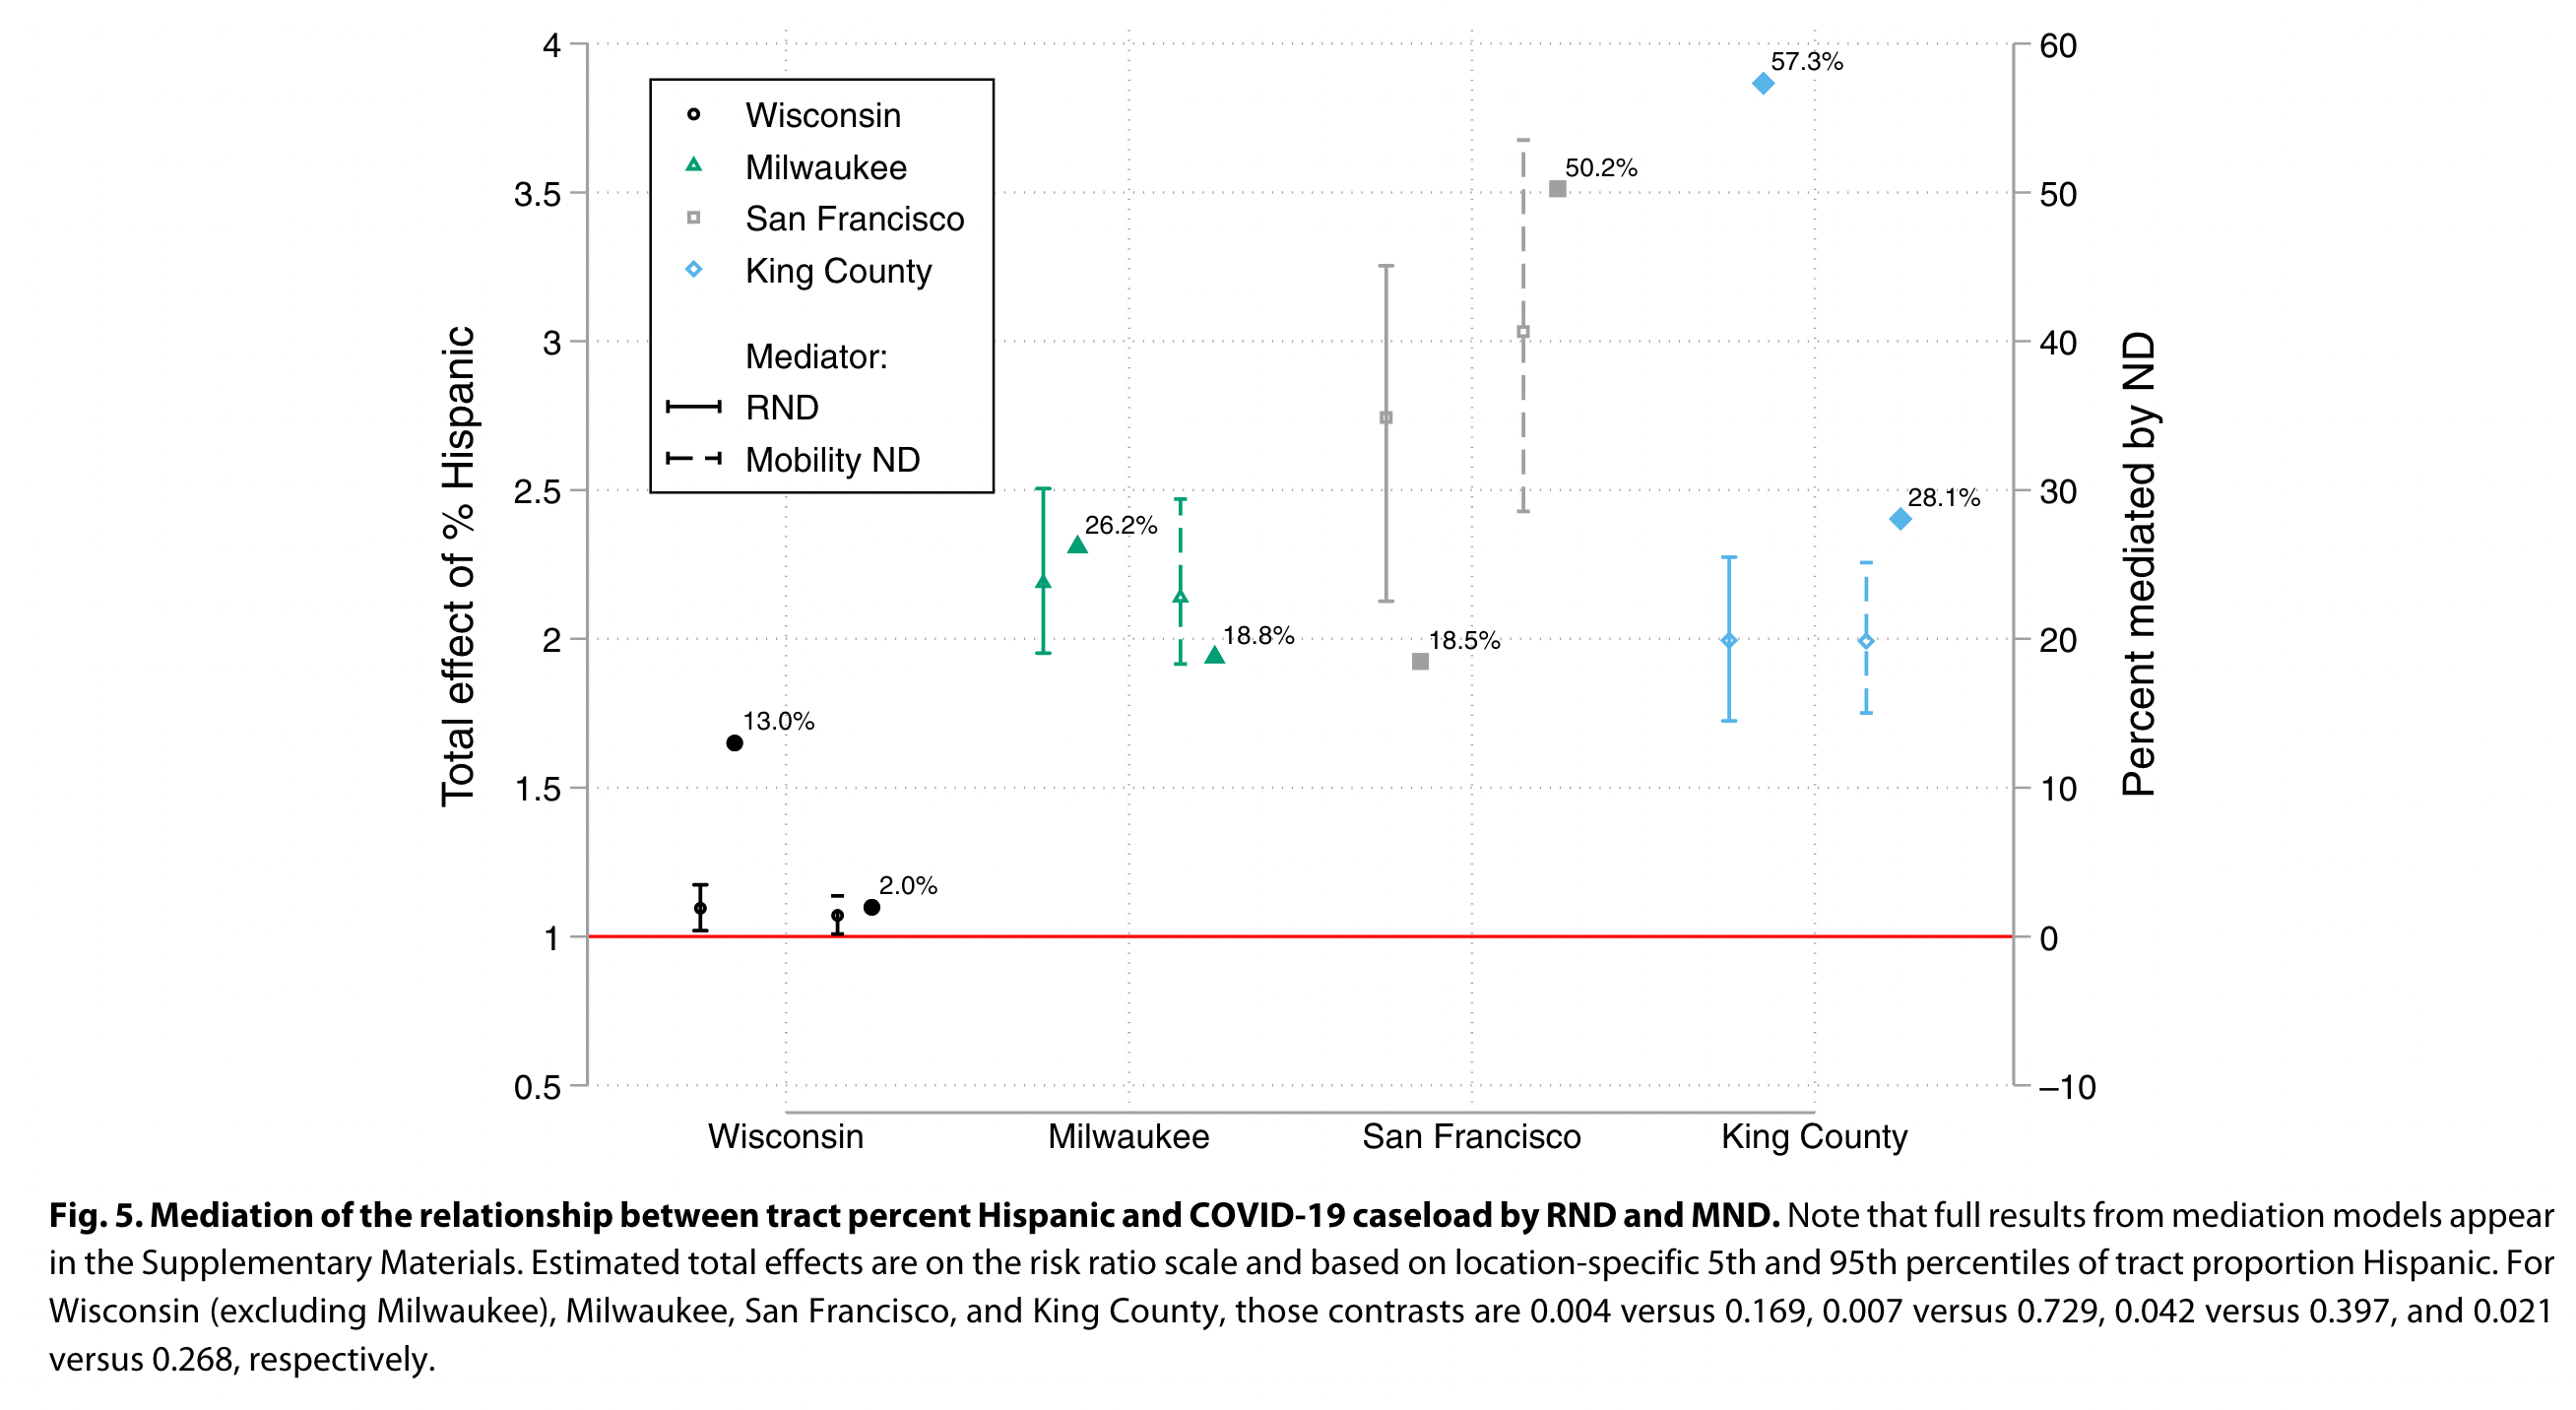
Mediation of neighborhood percent Hispanic residents by RND, MND